Creating a Two-way Table
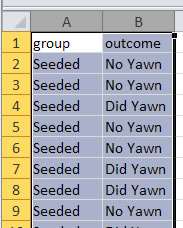
After collecting the data, the next step is to produce some numerical and graphical summaries of the sample data. The goal is to discuss the overall patterns in the data. Here we don’t want to just present a bunch of "yawned" and "didn't yawn" outcomes but a simple number and a picture or two that best represents what we learn from the data.
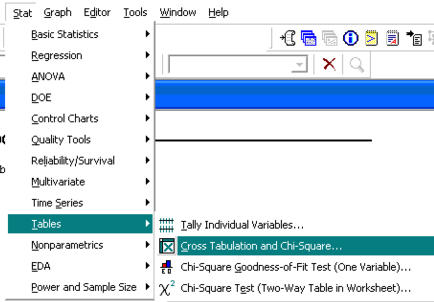
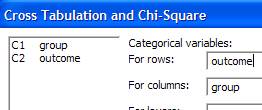
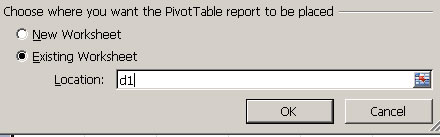
(a) Use technology to organize the data in a two-way table of counts:
| Click here to display Minitab instructions | OR | Click here to display Excel instructions |

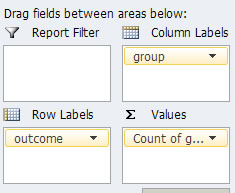
Take a screen capture of the table and copy and paste it into your lab report. Then return back here and click the Next button for futher instructions.