Application
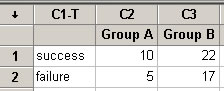
Part of the reason the Mythbusters found their study so convincing was what they considered to be a large sample size. In this application you will explore the effect of sample size on the p-value. Suppose instead they had obtained the following two-way table:
|
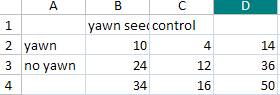
yawn seed | control group | Total |
| yawned | 20 | 8 | 28 |
| didn't yawn | 48 | 24 | 72 |
| Total | 68 | 32 | 100 |
(a) Calculate the difference in conditional proportions for this table (seeded minus control, show your work). How does it compare to that of the actual study (larger, smaller, the same)?
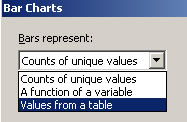
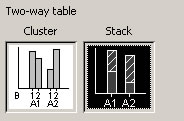
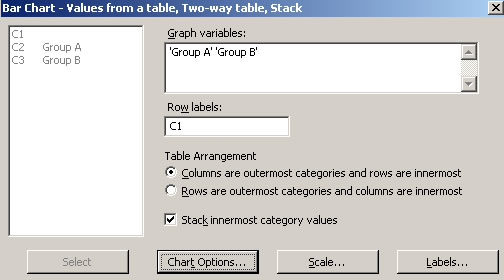
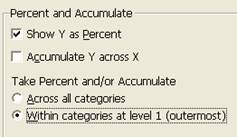
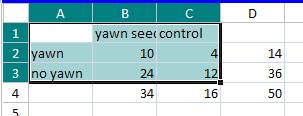
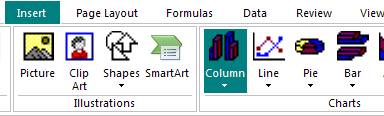
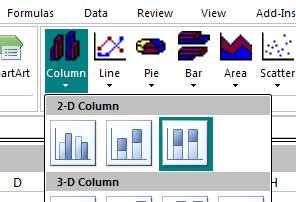
Also include a segmented bar graph displaying this group comparison. Now you want to create the bar graph directly from the two-way table rather than having the "raw data." Adapt one of the following sets of instructions for this data table.
| Click here to display Minitab instructions | OR | Click here to display Excel instructions |
Copy this graph into your report.
(b) How does the difference in conditional proportions and segmented bar graph change for this version of the data?
(c) Conjecture (state your intuition, no wrong answer) how you think the p-value for this table will compare to that of the actual study (larger, smaller, the same).