Descriptive Statistics
Open the Excel file below to see the data for your section.
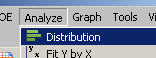
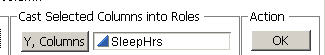
First we will look at a graph and numerical summaries of the sample data. Press the link below to view technology instructions for the Descriptive Statistics applet.
|
Click here to display applet instructions |
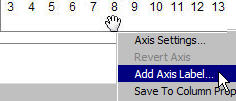
(a) Include a copy of this output in your report (remember to make sure you have a title AND an axis label!).
(b) Write a paragraph summarizing the distribution of the sleep time responses in this sample:
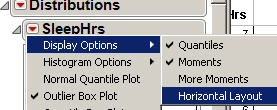
You should identify the variable (context), the sample size, describe the shape (e.g., roughly symmetric or skewed to the right or skewed to the left?), report the sample mean (including a suitable symbol and measurement units), and report the sample standard deviation (including a suitable symbol and measurement units). Also make sure you discuss any unusual observations or outliers (1 or 2 individual observations that don't follow the general pattern).
Also comment on whether the data support the research conjecture that Cal Poly students average less than 8 hours of sleep on a typical Sunday night (i.e., is the sample mean in the "right" direction)?