When the sample size condition for the Central Limit Theorem is met, we can use Minitab or the Test of Significance Calculator applet to obtain a p-value and confidence interval.
(l)
Is the sample size from our study of sleep times large enough for us to assume that the shape of the distribution of sample means will be approximately normal? Justify your answer.
(m) Regardless of your answer to (l) (for practice), use technology to calculate the t test statistic and p-value.
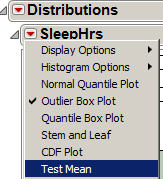
- Use the red arrow next to Sleep Hrs to pull down the menu.
- Select Test > Mean.
- Specify our Hypothesized Mean. Press OK. (We are not assuming we know the population standard deviation.)
|  |
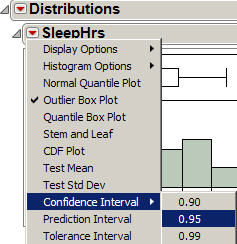
- Now use the pull-down menu from the SleepHrs box and select Confidence Interval > .95.
- Focus on the Lower CI value and the Upper CI value in the first row (for the mean).
- Copy and paste the resulting Test Mean and Confidence Intervals output into your report
|  |
Copy and paste this output into your report.
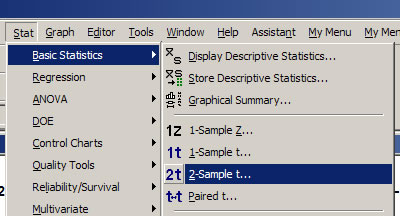
- Again select Stat > Basic Statistics > 1-Sample t.
- The sleep data should still be in the Samples in columns box.
- You can unselect the Perform hypothesis test box,
- but click Options and make sure the Confidence level is set to 95.0 and the Alternative is set to "not equal."
|
 |
Copy and paste this output into your report.
Test of Significance Calculator applet
- Use the pull-down menu to change from One proportion to One mean.
- Enter the summary statistics (from our actual class data) and press Calculate.
- Check the Test of significance box.
- Specify the hypothesized value of the mean and if necessary press the button on the second line to toggle the direction of the alternative hypothesis.
- Press Calculate.
- Scroll down and also check the Confidence Interval box.
Press Calculate CI.
- Include a screen capture of your input and output in your report.
(n) Provide an interpretation of the test statistic provided in the output.
(o) Report the relevant p-value. Provide an interpretation of this p-value in this context. Hint: The proportion of random samples that... assuming ....
(p) Based on this p-value (and the standard cut-off values from Lab 1), how much evidence do the sample data provide against the null hypothesis?
(q) Provide a one sentence interpretation of the confidence interval. Hint: What is supposed to be in the interval?