Then open the Excel file link to access the data from the study conducted in class. If your instructor does not provide you with a file, you may use the link below.
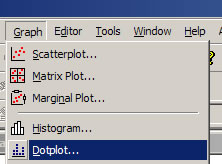
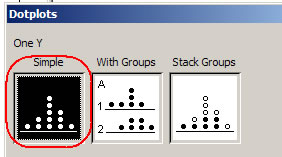
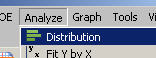
First we will look at a graph and numerical summaries of the sample data. Press one of the links below to view technology instructions based on whether you are using Minitab or an applet.
| Click here to display Minitab instructions | OR |
Click here to display applet instructions |
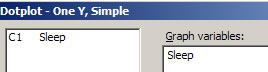
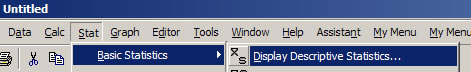

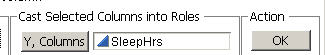
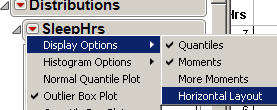
(a) Produce numerical and graphical summaries of you sample data. Include a copy of this output in your report (remember to make sure you have a title or an axis label!).
(b) Write a paragraph summarizing the distribution of the sleep time responses in this sample. (Make sure you discuss (with supporting evidence) shape, center and spread (using appropriate symbols), outliers, other unusual observations, and sample size, and that your comments are in context.)
(c) Does the shape of the distribution behave as you expected in the pre-lab?
(d) Do these data provide preliminary evidence that students at your school tend to sleep less than 8 hours on a typical night?