Summarizing the Observed Data
After collecting the data, the next step is to produce some numerical and graphical summaries of the sample data. The goal is to discuss the overall patterns in the data. Here we don’t want to just present a bunch of "helper" and "hinderer" outcomes, but a single number and a picture or two that best represents what we learn from the data. First some terminology:
- The observational units are the objects we are measuring. Here, the observational units are the infants who made a clear choice.
- The sample size is the number of observational units for which we have data. Here, n = 16.
- The variable is the "question" posed to each observational unit. Here, "which object did the infant select."
- This is a categorical rather than quantitative variable. A categorical variable with only two categories is often referred to as a binary variable. With a binary variable, we often label the two outcomes as "successes" and "failures."
Numerical Summary
To summarize a binary variable numerically, we just want to know the count and proportion for each category (Helper or Hinderer). Here we could choose to consider selecting the Helper toy to be the "success."
(a) Examine the results in the file, and then in the Summarizing the Observed Data section of your Word file, enter the count, proportion, and percentage of infants that chose the helper toy. Hint: Proportions are always numbers between 0 and 1 (inclusive). Please report proportions to at least 3 decimal places. Then return to this page.
Graphical Summary
(b) Choose between a free online applet or Excel and follow the appropriate link below for instructions on making a simple bar graph of these results.
| Click here to display the applet/instructions. | OR | Click here to display Excel instructions |
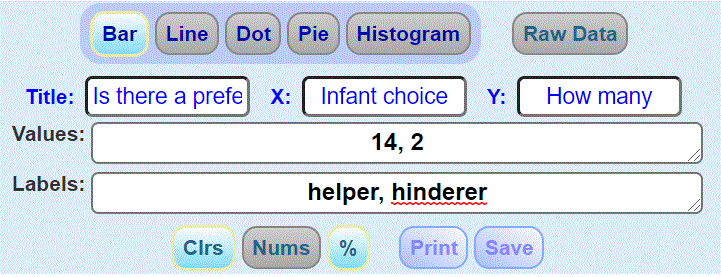
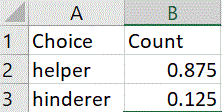
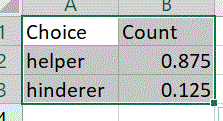
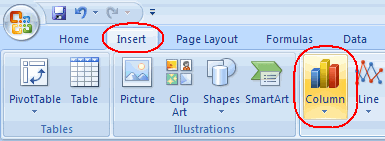
Make a screen capture of your results (or right-click and copy image?) and paste them into your Word file.