Workshop Statistics: Discovery with Data and Fathom
Topic 9: Correlation Coefficient
Activity 9-1: Properties of Correlation
(a)
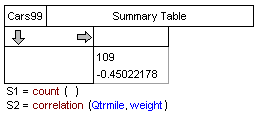
The correlation between
QtrMile and Weight is -.45.
(b)-(c)
| |
strongly positive
|
|
mildly positive
|
|
virtually none
|
|
mildly negative
|
|
strongly negative
|
|
letter:
|
B
|
F
|
I
|
E
|
C
|
H
|
A
|
G
|
D
|
|
r
|
.994
|
.889
|
.51
|
.235
|
-.081
|
-.244
|
-.45
|
-.721
|
-.907
|
(d) Answers will vary from student to student (largest = 1, smallest
= -1)
(e) Correlations of 1 or -1 occur when the observations pairs form
a straight line.
(f) A positive correlation indicates a positive association.
A negative correlation indicates a negative association
(g) Correlation values near + 1 are strong, while values near
0 are weak.
(h) There appears to be a strong association, with the average monthly
temperature increasing during the first half of the year as the month number
increases, then decreasing during the second half of the year (after month
seven) as the month number increases.
(i) r = .257; This value seems to indicate a relatively
weak positive relationship. This is not consistant with our answer
for (h). This happened because r measures the strength of
the linear association. While these variables are clearly related,
they are not linearly related.
(j) r = .507; This indicates a moderate positive association,
though one would not guess this from the scatterplot.
(k) r = -.505
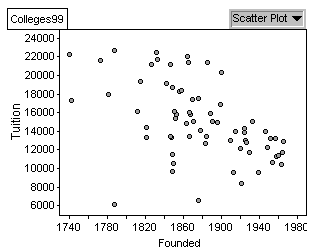
With public colleges, the
majority of the more expensive schools were founded relatively recently,
while the older school tended to be a bit cheaper. However, with
private colleges, the reverse appears to be true; tuition costs tend to
decrease with later founding dates, making the newer schools cheaper and
the older schools more expensive.
Activity 9-2: Monopoly Prices
(a)
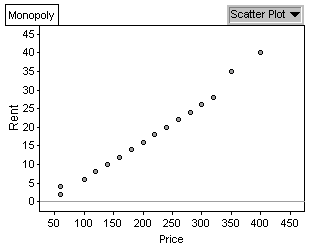
Guesses will vary from student
to student, but looks quite strong so r should be close to 1.
(b) r = .994
(c)
|
Boardwalk price
|
400
|
400
|
400
|
400
|
100
|
1
|
1
|
|
Boardwalk rent
|
40
|
100
|
1
|
1000
|
40
|
40
|
100
|
|
actual correlation
|
.994
|
.794
|
.670
|
.490
|
.707
|
.538
|
-.019
|
(d) The correlation coefficient is not a resistant measure of association.
A single change in the data can have a drastic effect on r.
Activity 9-3: Cars' Fuel Efficiency (cont.)
(a)
|
model
|
weight
|
z-score
|
city MPG
|
z-score
|
product
|
|
Chevrolet Corvette
|
3295
|
0.833
|
17
|
-1.270
|
-1.058
|
|
Saturn SC
|
2420
|
-1.613
|
27
|
2.015
|
-3.250
|
(b) r = -.816
(c) Most of the cars with negative weight z-scores have positive city
MPG z-scores. A strong negative association means that most positive
z-score values of one variable will correspond to negative z-score values
of the other variable, and vice-versa.
(d) r = -.816; yes, this agrees with what we calculated in (b)
Activity 9-4: Televisions and Life Expectancy
(a) fewest: United States - 1.3; most: Haiti - 234
(b)
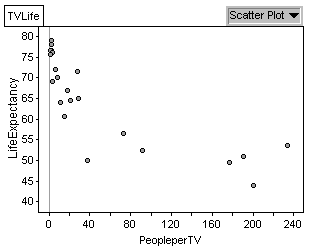
There appears to be a negative
association between the two variables. The countries with higher
life expectancies have less people per TV.
(c) r = -.804
(d) Many factors affect life expectancy, e.g., wealth of the nation.
Most of them are most likely more influential than the number of people
per TV.
(e) No, other factors could be influencing the apparent association.
(f) Answers will vary from student to student, but some possibilities
are technological advancements of the country, wealth of the country, medicinal
advancements of the country.
Activity 9-5: Guess the Correlation
(b)-(f) Answers will vary from student to student.
(g) The correlation would be one (all the points would lie in a straight
line).
(h) The correlation would still be one.
(i) A correlation of one does not necessarily indicate perfect guessing
as shown in (g) and (h). Thus, the correlation coefficient isn't
the best way to determine the best guesser.