Workshop Statistics: Discovery with Data and Fathom
Topic 16: Sampling Distributions I: Proportions
Activity 16-1: Parameters and Statistics
the proportion of men in the entire 1999 U.S. Senate: parameter, q,
.91
the proportion of Democrats among the following five Senators: statistic, ,
.4
the mean years of service among these five senators: statistic, ,
11
the standard deviation of the years of service in the 1999 U.S. Senate:
parameter, s, 9.755
Activity 16-2: Colors of Reese's Pieces Candies
(a) Answers will vary from student to student.
(b) statistic, (c) parameter, q
(d) no
(e) yes
(f) no
(g)-(h) Answers will vary from class to class
(i) observational units: Reese's Pieces candies; variable: color
of candies (whether or not the candy is orange)
(j) Answers will vary from class to class.
(k) no
(l) Answers will vary from student to student (where is the distribution
centered)
(m) It is probable that most students' estimates would be reasonably
close to the true parameter value, while some would be way off. There
is no bias in the sampling, and it is done randomly.
(n) The spread/variabilty would be larger. (almost might not look as
normal)
(o) the spread/variabilty would be smaller.
Activity 16-3: Simulating Reese's Pieces
Students' answers to (b)-(p) may differ since the
data is chosen randomly. These are meant to be sample answers.
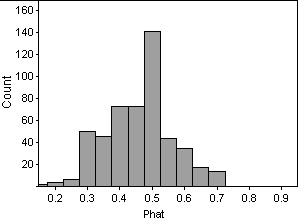
(b)
(c) The distribution of proportions is roughly symmetrical, centered
at about .45.
(d) sample answers: mean of
values: .461; standard deviation of
values: .101
(e) yes
(f)
how many of the 500
sample proportions
percentage of the 500
sample proportions
within + .10 of .45
332
66.4%
within + .20 of .45
477
95.4%
within + .30 of .45
500
100%
(g) 95.4%, which is the same as the percentage of the 500 sample proportions
within + .20 of .45.
(h) You would have no way of knowing for sure, but you could be reasonably
confident that your sample proportion was within .20 of the population
proportion because there would only be a 5.6% chance of being wrong.
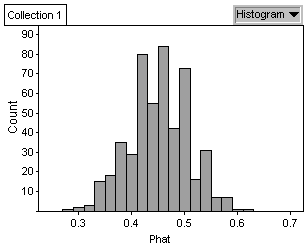
(i)
mean of
values: .451; standard deviation of
values: .056
(j) The values are clustered closer to the mean.
(k) 466 candies; 93.2%
(l) There are now 134 more orange candies in this interval, which increases
the percentage by 26.8 percentage points.
(m) A sample proportion is more likely to be close to the population
proportion with a larger sample size.
(n) A larger sample size creates a taller, skinnier curve, meaning
a smaller standard deviation. Changing the proportion parameter shifts
the center of the distribution.
(o) standard deviation = .056, .056 x 2 = .112, .451 - .112 = .339,
.451 + .112 = .563
(p) 477 fall within .339 and .563. This is 95.4% of the sample
proportions, which is close to the 95% predicted by the empirical rule!
(q) 95.4%, which is the same as the percentage of the 500 sample proportions
within + .20 of .45.
(r) theoretical mean of values:
.45; theoretical standard deviation of p-hat values: .099, sinceSD()
= sqrt(q(*(1-q)/n)
(s) theoretical mean of values:
.45; theoretical standard deviation of p-hat values: .057, since
SD() = sqrt((q*(1-q))/n)
Activity 16-4: ESP Testing
(a) ESP test subjects
(b) Yes, mound-shaped and symmetric with a single peak.
(c) 1,141; no, it's 25%
(d) This would not be very surprising, since 2,912 (proportion = .29)
test subjects got at least 30% right.
(e) This would be fairly surprising, since only 49 (proportion = .0049)
test subjects got at least 45% right.
(f) Since only 2 test subjects out of 10,000 got at least 50% right,
we would be fairly convinced that someone who scored a 50% would possess
the ability to get more than 25% correct in the long run. This type of
outcome is extremely unusual if someone really only has a 25% success rate.
(g) Since 1,821 test subjects got at least 32.5% right, we would not
be quite as convinced that someone who scored a 32.5% would possess the
ability to get more than 25% correct in the long run. This type of result
is not the unlikely, even for someone who really guesses at 25%.