Workshop Statistics: Discovery with Data, Second
Edition
Topic 8: Graphical Displays of Association
Activity 8-1: Cars' Fuel Efficiency (cont.)
(a) observational units: cars
(b) 2 variables are recorded for each car
-
city MPG = quantitative
-
weight = quantitative
(c)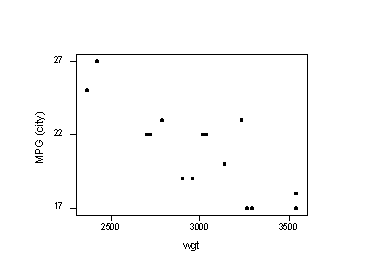
(d) Yes, it appears that cars that weigh less get better mileage than
cars that weigh more.
(e) Fuel efficiency is negatively associated with weight.
(f) Yes, are several such examples, e.g. eclipse and cougar.
Activity 8-2: Guess the Association
(a) Answers will vary from student to student, but this is a good example:
-
¼ mile and weight: moderately negative
-
¼ mile and acc 0-60: very strong positive
-
fuel cap and page num: no real association
-
hwy mpg and city mpg: pretty strong positive
-
hwy mpg and fuel cap: pretty strong negative
-
front wgt and fuel cap: moderately negative
-
front wgt and city mpg: slight positive
-
city mpg and weight: strong negative
-
¼ mile and city mpg: moderately positive
(b) Answers will vary from student to student, but this is a good example:
-
length and width of signatures: positive, weak
-
SAT score & college G.P.A.: positive, strong
-
latitude & avg. January temperature of U.S. cities: negative, strong
-
lifetime & weekly cigarette consumption: negative, moderate
-
serving size & calories of fast food sandwiches: positive, weak
-
airfare & distance to destination: positive, moderate
-
birth rates & death rates of U.S. states: none, none
-
foot length & height: positive, strong
Activity 8-3: Marriage Ages (cont.)
(a) There is a fairly strong positive association between the husband's
age and the wife's age.
(b) 2
(c) 16, above the line
(d) 5, below the line
(e) According to the data collected, the husband tends to be older
than the wife in married couples.
Activity 8-4: Space Shuttle O-Ring Failures
(a)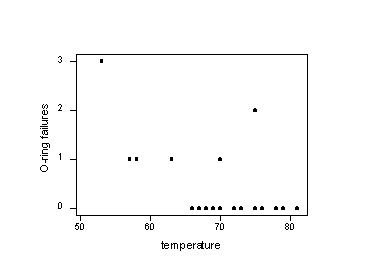
There seems to be a slightly
negative association between O-ring failures and temperature, with fewer
failures at higher temperatures.
(b) It seems very likely that there would be an O-ring failure.
(c)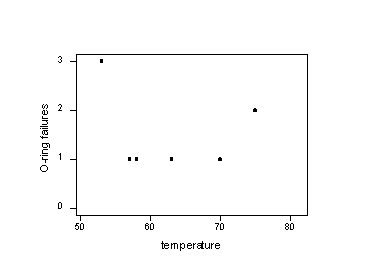
This scatterplot does not
show any real association.
(d) The flights with zero failures gave a lot of information about
how failures were related to temperature.
Activity 8-5: Fast Food Sandwiches
(a)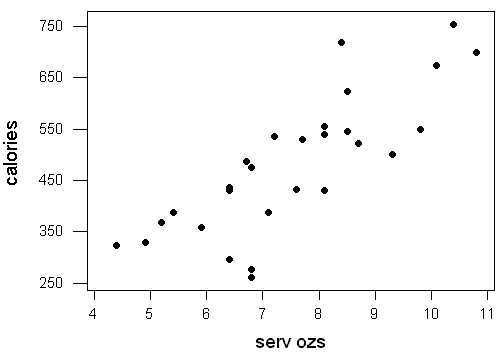
There is a fairly strong
positive association between a sandwich's serving size and its calories.
The number of calories tends to increase with the number of ounces in a
serving.
(b)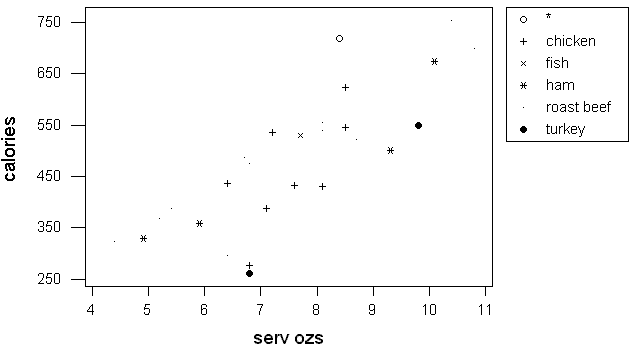
Roast beef tends to have
more calories than other sandwiches of similar serving sizes but different
meats. Turkey tends to have less calories than other sandwiches of
similar serving sizes but different meats. Ham and chicken seem to
vary.
For the Calculator version, the graph is as follows:
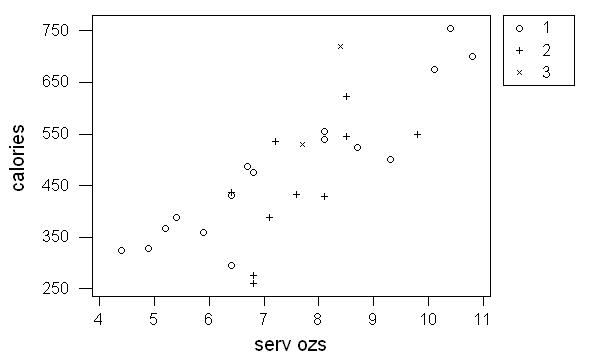
We still see that the meat groups tend to higher calories for their
serving size than the poultry groups.