Stat 414 – Review 1 Problems
I would consider
these problems “further practice” (on the most recent material) more than
examples of questions I would ask you. For example, on the exam, I probably won’t ask you to make a graph, but you should be thinking
about the important components in such a graph.
Below I ask you to compare some models, on the
exam I would expect you to be able to anticipate some of the comparisons. See
also the (two) Regression practice question sets in PolyLearn
1) Data was collected on corn grown on the island of Antigua (corn.txt). The response variable is the harvest weight (harvwt) per plot (unknown units). There are eight sites with eight separate plots within each site where the corn is grown under the same treatment condition. One question of interest is whether site has an effect on harvest weight.
(a) Identify the response variable and the Level 1 units and Level 2 units.
(b) Produce a graph of the harvest weights for the eight sites. Does there appear to be substantial site to site variation?
(c) Explain how we could use a traditional one-way ANOVA to model these data: identify the parameters, identify the error. Write out the statistical model (with proper indices, assumptions of error distribution, parameters).
(d) State null and alternative hypothesis and report a test statistic and p-value for assessing the site-to-site variation. Also produce a table of the estimated coefficients for the sites.
Now suppose we want to use a multilevel model. The main advantages are the ability to have plot level covariates, as well as site level covariates and an estimate of the error associated with the site level.
(e) Write out a statistical model for such a multilevel model, defining the parameters, with proper indices, assumptions of error distributions.
(f) State null and alternative hypothesis and report a test statistic and p-value for assessing the site-to-site variation.
(g) Also produce a table of the estimated coefficients for the sites. How does these compare to the estimates from (d)? Why?
(h) Estimate and interpret the intraclass correlation coefficient. (How does this compare to R2 from the one-way ANOVA?)
(i) Examine the residuals vs. fits graphs for this model and summarize what you learn.
2) A researcher is interested in seeing how different light conditions (Long = 16 hr days, Short = 8 hr days) affect the concentration of an enzyme in golden hamsters in heart tissue. Ten hamsters are randomly placed into each of the two light treatment groups, for a total of twenty hamsters. After a treatment period of several weeks, the hamsters are sacrificed and enzyme concentration (mg/ml) is measured in four subsamples of heart tissue for each hamster. The data are in the file hamster.txt. The primary research question is to compare the effects of light on the enzyme concentration in heart tissue.
(a) Display a graph that highlights the primary research question.
(b) Fit and interpret a model that addresses the primary research question. Summarize your results.
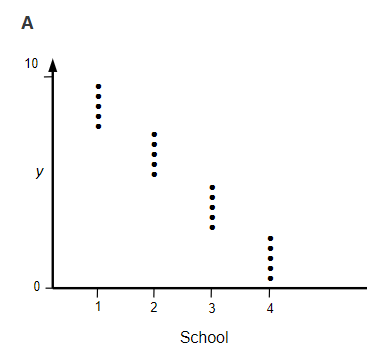
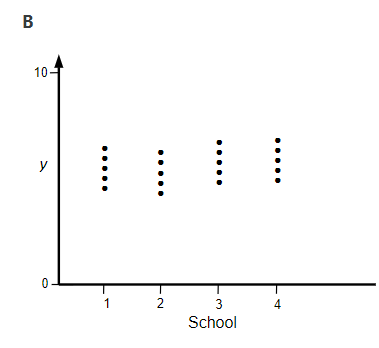
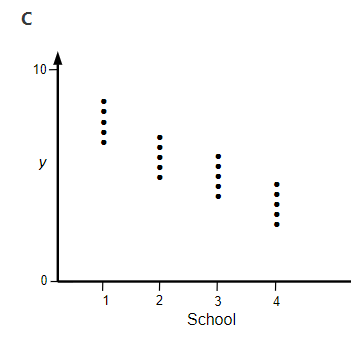
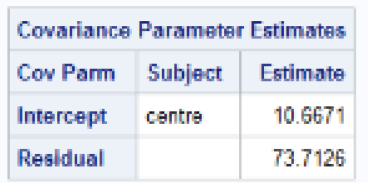
3) Suppose we have student exam scores for four schools.
(a) Which graph has the largest intraclass correlation coefficient?
|
|
|
|
(b) Reconsider graph A, and the estimated random effect for school 1. Would this estimate of u1 change (and if so how) if we sampled more students from each school, but the distribution of exam scores within all four schools remained the same (and the proportion of the total sample size remained the same).
(c) And (how) would the confidence interval around that estimate change?
4) The following are modeling results for a randomized
controlled trial at 29 clinical centers. The dependent variable is diastolic
blood pressure.
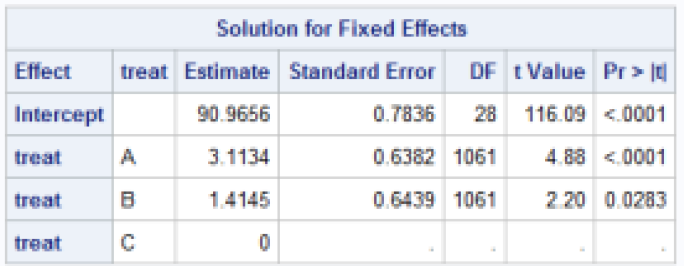
(a) What is the expected diastolic blood pressure for a
randomly selected patient receiving treatment C at a center with average
aggregate blood pressure scores?
(b) What is the expected diastolic blood pressure for a
randomly selected patient receiving treatment C at a center with aggregate
blood pressure scores at the 16th percentile?
(c) What is the expected diastolic blood pressure for a
randomly selected patient receiving treatment B at a center with aggregate
blood pressure scores at the 97.5th percentile?
(d) What is the expected diastolic blood pressure for a
randomly selected patient receiving treatment A at a center with aggregated
blood pressure scores at the median?