Stat 414 – HW 3
Due Friday, Oct. 11, 2pm
1) A
randomized controlled trial was used to determine
whether a new intervention for insomnia was effective. The significance level
for this study was set a priori as 0.05. The primary outcome in the
study was average hours of sleep per night, and outcome data for each
participant was collected at baseline and 6 months. An
independent samples t-test was applied to compare the mean change in average hours of
sleep per night for the intervention and control groups. Results showed the
intervention group demonstrated an increase in the average amount of sleep per
night as compared to the control group, and the p-value for this statistical
test was p=0.03. The findings
answered the research question and the researcher concluded the intervention
was effective in treating insomnia.
(a) What does “a
priori” mean in this content and why is that an important consideration here?
(b)
In this scenario we
have two measurements for each participant, one taken at baseline and one taken
at 6 months. These repeated measures are dependent. Should a
paired t-test have been used
to test for mean change? In other words, was a mistake made
in the analysis?
(c) With the
information provided, what can you say about statistical power for this test? (e.g.,
was the study adequately powered, underpowered, need more information, etc.)
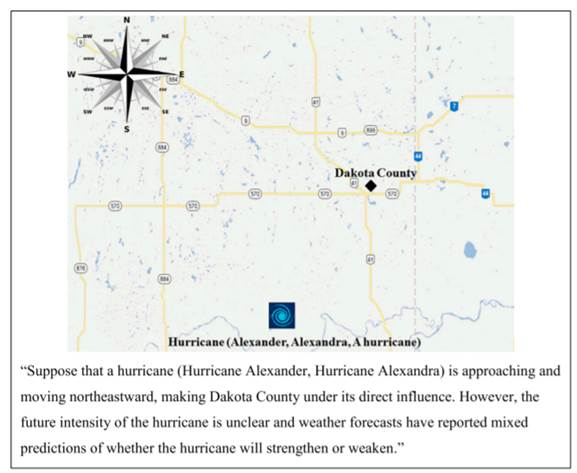
2) A study by Jung et al. (2014, “Female hurricanes are deadlier than male hurricanes,” Proceedings of the National Academy of Sciences in the USA, 111(24), 8782-8787) looked at hurricane names and their perceived threat. They thought that if hurricanes had male names they would be perceived as more dangerous than if they had female names. In one part of the study the participants were given a weather map showing a hurricane moving towards the area where they lived. Participants were told the name of the hurricane and rated the riskiness of the hurricane on a seven-point scale, with 1 being not at all and 7 being very risky. In Experiment 1, they used five male and five female names from the official 2014 Atlantic Hurricane registry.
(a) Using the data in HurricaneNames1.txt produce a graph and some numbers comparing the ratings given to the 10 hurricanes. Is there evidence that hurricanes with male names are predicted to be more intense that hurricanes with female names?
(b) Create the variable (sum of ratings given to male names) – (sum of ratings given to female names) (include your code). Fit a “null model” for this variable and interpret the intercept in context. Is the intercept statistically significant? Include and interpret in context a 95% confidence interval for the intercept. What are the observational units of this analysis (how many are there)?
(c) Prepare the data: Convert the data to “long” format and code the hurricane names as male or female:
library(tidyverse)
hurr %>% gather(HurrName, Score, Arthur:Marco) %>%
mutate(
HurrGend = case_when(
HurrName %in% c("Arthur", "Cristobal",
"Omar", "Kyle", "Marco") ~ 0,
HurrName %in% c("Bertha", "Dolly", "Fay",
"Laura", "Hanna") ~ 1
)
) -> hurr_long
(d) Does the subject-to-subject variation appear substantial?
(i) Report and interpret the intraclass correlation coefficient
(ii) Carry out (a traditional) ANOVA on subject, is the F-test statistically significant?
(e) Run
an analysis predicting the rating from the gender of the hurricane name, treating
the subjects (SN = subject number) as random.
Include and interpret a 95% confidence interval for the hurricane name gender effect. What are the observational
units of this analysis (how many are there)?
Write out a model equation (in terms of ![]() ’s
and u’s) for this model.
’s
and u’s) for this model.
(f) Which analysis (b) or (e) gives stronger evidence of a hurricane-name-gender effect? How are you deciding and why do you think that is?
(g) For the analysis in (b), add the gender of the participant into the model. How do you interpret the coefficient of this variable (Hint: Think in terms of interaction and how we have defined the response variable) and what do you conclude about its significance?
(h) Rerun the analysis in (e), ignoring the SN variable. Briefly summarize whether and why the results for this analysis differ.
(g) Suggest another variable about the hurricanes that you would be interested in including in the analysis (assuming it was available). Suggest another variable about the participants that you would be interested in including in the analysis (assuming it was available).
3) Cal Poly student
researchers wanted to assess the impact of wearing a swim cap and the type of
swim stroke (freestyle, breaststroke, backstroke, and butterfly) on 25-yard lap
times (Basurto, Frattone, & Garcia, 2015). Swimmers at the campus recreation center were recruited and confirmed they were comfortable with all four
strokes at that distance. Four swimmers were randomly assigned
to each of the eight conditions in random order, giving each swimmer one minute
to rest between laps. The data (long format) are
in swimtimes.txt.
(a) Explain what
the “8 conditions” represent.
(b)
Fit a model with whether or not a cap was worn, type
of swim stroke, and the interaction, using the swimmer as a random effect. Is
there significant evidence of an interaction
effect? Write out a model equation (in terms of ![]() ’s
and u’s) for this model.
’s
and u’s) for this model.
(c)
Does the swimmer-to-swimmer variation appear substantial?
(i) Report and interpret the intraclass correlation coefficient
(ii) Carry out an ANOVA on swimmer,
is the F-test statistically
significant?
Extra Credit:
Would we have been able to carry out a significance test for the interaction effect
if the subjects has been treated as fixed? Explain.
4) Read
the article by McCulloch (2015).
(a) Identify two
ideas/concepts/issues that you recognized/agreed with/understood/learned about.
(b) Identify two
questions you have after reading the article.