|
Definitions: ·
Type I Error = rejecting the null
hypothesis even though it’s true (e.g., false alarm) o
The probability of a type I error is
controlled by the level of significance. ·
Type II Error = failing to reject
the null hypothesis even though it’s false (e.g., missed opportunity) o
The power of a type II error is often
calculated with respect to a specific alternative value for the parameter of
interest (e.g., he’s become a 0.300 hitter) o Several factors impact the probability of a type II error |
Recap of
Investigation 1.7
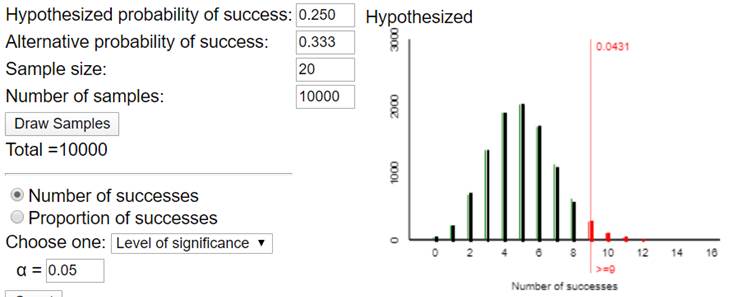
Manager believes the player to be a 0.250 hitter, but player claims to now be a 0.300 hitter.
A type II error is committed if the manager fails to decide the player has actually improved.
With the Power Simulation applet,
|
|
This is the distribution of the number
of successes assuming |
|
|
This is the distribution of the number
of successes assuming |
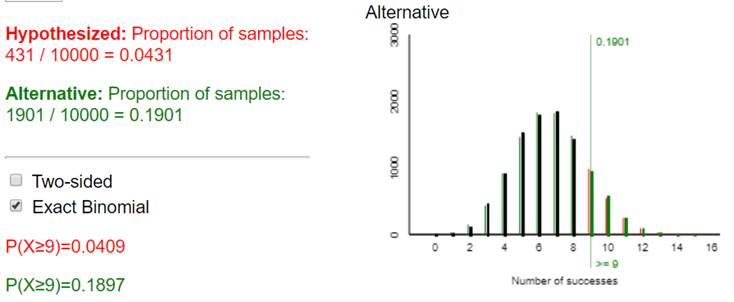
The probability of a Type II error = 1 – power, so in this case, there is about an 80% chance that the manager will decide the player has not improved even though he actually had.
Calculating power is a two-step process
Step one: Determine the rejection region
corresponding to the null hypothesis hypothesized value, the direction of the
alternative hypothesis, and the level of significance.
Step two: Determine the probability of obtaining an observation in the rejection region for a specific alternative value of the parameter.