Stat 301 - HW 8
Due noon, Friday, March 13
Please remember to submit
a separate file for each problem (with the problem number in the file name and
your name inside the file) and to integrate all relevant computer output. Also remember the Extensions assignments have
their own submission page in Canvas.
JMP Note: To
run a “matched pairs analysis” in JMP (using the two columns of data), it’s now
under Analyze > Specialized Modelling > Matched Pairs
0) Confirm with me if you requested a switch to final exam
days
(2pm section:
Friday 1:10-4pm, 3pm section: Monday 1:10-4pm in 10-215)
Interest in
review sessions? 3/15, 3/19
Two online
course evaluations
1) Suppose you want to compare student’s performances on the first two exams in a course to see whether there is convincing evidence that students (in general) tend to perform better on the first exam.
(a) Would you recommend a paired design or an independent samples design? Justify your recommendation,
clarify how each design would differ in this context.
(b) Consider the following two classes. In
one class, pairing appears to be useful, but not in the other class. Explain how you can tell, and what this implies about students’
exam performances in the two classes.
Class A
|
|
|
|
|
Class B |
|
|
|
Exam 1
|
n1 = 12 |
|
s1 = 9.5 |
|
Exam 3
|
n3 = 12 |
|
s3 = 9.5 |
|
Exam 2 |
n2 = 12 |
|
s2 = 12.3 |
|
Exam 4 |
n4 = 12 |
|
s4 = 12.3 |
|
Differences |
nd = 12 |
|
sd = 4.5 |
|
Differences |
nd = 12 |
|
sd = 18.0 |
(c) Below is output of a power analysis in
JMP for an independent samples design.
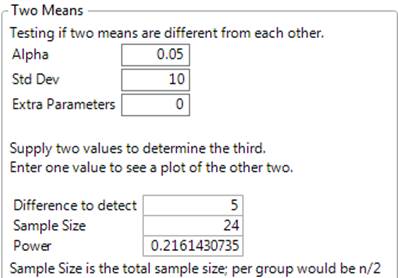
Explain
the output to a non-statistician. Your
explanation should include
·
Definitions
of Alpha, Std Dev, Difference to detect, Sample Size
·
Interpretation
of the calculated power value in context
·
Sketches
(probably by hand) of the null and alternative sampling distributions, showing
the area under the curve representing power
Hint: If you are having trouble
visualizing this process, perhaps check out this applet: http://www.rossmanchance.com/applets/TwoPopulations.html?population=model
Also keep in mind that calculation of power is a two-step process.
(d) Below is output of a power analysis in
JMP for a paired samples design
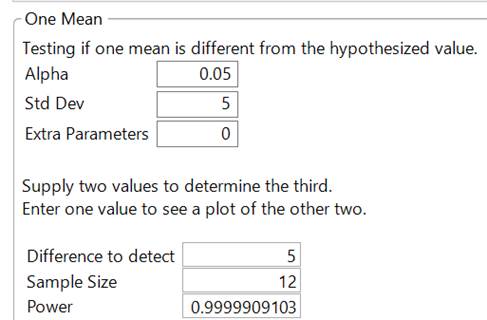
Explain
to a non-statistician why the set up of the
calculation has changed, whether this is reasonable, and why and how the power
has changed so much.
2) hw8problem2.Rmd new 3/11
Does
the path that you take to “round” first base make much of a difference?
Hollander and Wolfe (1999) report on a Master’s Thesis by W. F. Woodward (1970)
that investigated different base running strategies. For example, you could
take a “narrow angle” or a “wide angle” around first base.
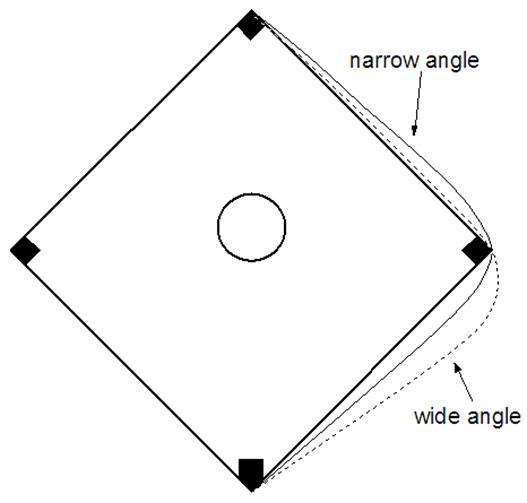
In Woodward’s study, he used a stopwatch to time 22
different runners going from a spot 35 feet past home
to a spot 15 feet before second. He had each runner use each method, with a
rest period in between, randomizing which method they used first. The data in BaseRunning.txt shows
the time (in seconds) for each running using the narrow angle and the wide
angle.
(a) Compute the differences in times (wide – narrow).
Produce, include, and comment on relevant graphical displays and numerical
summaries for investigating the question of whether there is an advantage for
taking wide angles or narrow angles.
(b) Define the parameter of interest in this study and
write the null and alternative hypotheses for testing whether there is an
advantage for taking wide angles or narrow angles.
(c) Conduct a paired t-test
or use the Matched
Pairs applet to determine whether the data suggest a genuine difference in
times for wide angles and narrow angles. If you use the t-test, make sure comment on whether you believe the test procedure
is valid and how you are deciding. (Remember to include your output.)
(d) Construct, include, and interpret a 95% confidence
interval for estimating the population mean difference in base running
times. (Be sure it’s clear in your
interpretation which method is faster.)
(e) Summarize the conclusions you would draw from this
study. Make sure you comment on significance, estimation, generalizability, and
causation.
(f) Using a sign test
(e.g., Investigation 2.7, Example 3.4).
State the corresponding hypotheses (in symbols and in words) and p-value
(exact binomial or normal approximation).
Compare your conclusions to those in question (c).
3) Researchers investigated a possible link between having a tonsillectomy and developing Hodgkin’s disease. They studied a sample of 85 Hodgkin’s patients who had a sibling of the same sex within 5 years of age who was free of the disease (170 individuals total, 85 pairs). Taking into account the paired nature of these data produces the following table:
|
|
Hodgkin’s
patient, had
tonsillectomy |
Hodgkin’s
patient, did
not have tonsillectomy |
Total |
|
Control, had tonsillectomy |
26 |
7 |
33 |
|
Control, did not have tonsillectomy |
15 |
37 |
52 |
|
Total |
41 |
44 |
85 |
(a) Identify
the observational units in this study. Clearly identify the population of
interest.
(b) For how
many pairs was the tonsillectomy outcome differ? How many “successes” and how many “failures”
(being clear how you are defining each of these.)
(c) Identify
the parameter of interest in this study.
(d) State
appropriate null and alternative hypotheses for determining whether the
Hodgkin’s sibling was more likely to have a tonsillectomy, in symbols and in
words.
(e) Apply McNemar’s Test to calculate an appropriate p-value
including the name of the appropriate probability distribution and also specify
its input values. Report the p-value
(include output) and summarize your conclusion in context.
(f) Calculate
and interpret a 95% confidence interval for the parameter in (c). Do you think your interval procedure is
valid?
Possible Extension Assignments
·
Use the Two Populations applet to verify/approximate the
power calculation in 1c. First, determine the rejection region, then estimate
the power. Be very clear your process
and include some screen captures. (Hint:
Are you using a one-sided or two-sided test? How do you use the rejection
region in step 1, to estimate the power in step 2?)
·
Find the “Ask Marilyn” column in Parade Magazine from Feb. 21, 2016. Review the discussion and how it relates to
this class.
·
Read, summarize, and critique Kwok et al. (2015) “Face touching: A frequent habit that has
implications for hand hygiene,” American
Journal of Infection Control, 43(112-4).
·
If you performed poorly on a HW
or Exam problem earlier in the quarter, include your reworked solution.
·
Review and reflect on the ASA
Press Release on p-values!
- Review,
summarize, and critique Tim Hesterberg’s article
on bootstrapping
- Submit an entry (this week) to
the CAUSE cartoon contest! The next cartoon and the
entry rules for the contest ending March 31 are at
https://www.causeweb.org/cause/caption-contest/march/2020/submissions