Stat 301 - HW 2
Due noon Friday
If you upload your assignment, please upload separate files for each problem. You should also use Word or PDF format only. Remember to integrate your output with your discussion.
Technology note: When inserting your screen captures into a Word file for submission, please use “in line with text.” If you need to check this, right-click on an image and choose Wrap Text > In Line with Text or (PC) under Size and Position, you can select Text Wrapping > In line with text. This will prevent the images from floating around.
1) Suppose we have a
binomial random variable with n trials and probability of success ![]() .
.
(a) In the One Proportion Inference applet, check the box on the far right to Hide Coins. Enter 25 as the Number of tosses and check the Exact Binomial button. Also check the Summary Statistics box. Include a screen capture of the binomial distribution.
(b) Check
the Show Sliders box below the graph. Slowly move the first white square to the
right (larger values of![]() ). Include a screen capture with
). Include a screen capture with ![]() above 0.90. How would
you describe the shape of this distribution? How have the mean and
standard deviation changed? Why (Hint: Use the formulas for E(X)
and SD(X) to justify your answer)?
above 0.90. How would
you describe the shape of this distribution? How have the mean and
standard deviation changed? Why (Hint: Use the formulas for E(X)
and SD(X) to justify your answer)?
(c) Now
move the slider close to zero and include a screen capture with ![]() below 0.10. How would
you describe the shape of this distribution? How have the mean and
standard deviation changed? Why (Hint: Use the formulas for E(X)
and SD(X) to justify your answer)?
below 0.10. How would
you describe the shape of this distribution? How have the mean and
standard deviation changed? Why (Hint: Use the formulas for E(X)
and SD(X) to justify your answer)?
(d) Now (keeping
![]() below 0.10) move the Sample Size slider to the right
(larger values of n). Include a screen capture with n > 100.
How would you characterize the shape of this distribution? How have the
mean and standard deviation changed? Why (Hint: Use the formulas
for E(X) and SD(X) to justify your answer)?
below 0.10) move the Sample Size slider to the right
(larger values of n). Include a screen capture with n > 100.
How would you characterize the shape of this distribution? How have the
mean and standard deviation changed? Why (Hint: Use the formulas
for E(X) and SD(X) to justify your answer)?
(e) For a
fixed value of n (say 100), find the value of ![]() that maximizes the
standard deviation SD(X). [Hint: Use the applet or use calculus to take
the derivative of the standard deviation formula with respect to
that maximizes the
standard deviation SD(X). [Hint: Use the applet or use calculus to take
the derivative of the standard deviation formula with respect to![]() , set to zero, and
solve for
, set to zero, and
solve for![]() .]
.]
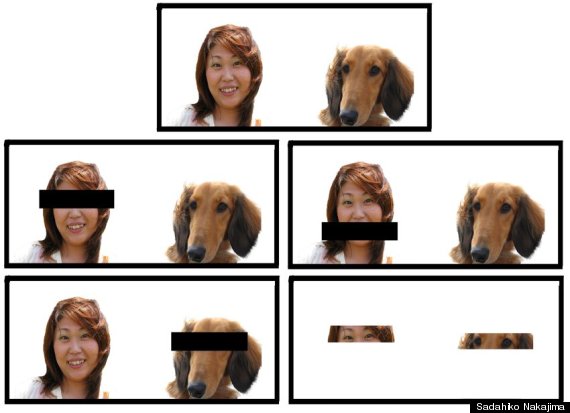
2) Researchers have tested the theory that “dogs look like their owners,” typically asking participants to match photos of dogs with their owners. Japanese psychologist Sadahiko Nakajima attempted to explore which features had the strongest connection. In his study, participants were shown two sets of 20 photos of dog-owner pairs, one set showed actual dog-owner pairings, the other set showed random pairings. To eliminate extraneous factors, the photos were very basic color headshots cropped at the shoulders and shown against a plain white background (see below). In one study (Anthrozoos, 26(4), 2013), participants where shown only pictures of the owner eyes and the dog eyes (bottom right photo). The participants’ task was to: “Choose the set of dog-owner pairs that physically resemble each other, Set A or Set B.” In this study, 54 Japanese undergraduates, 40 identified the correct set of photos.
(a) Identify the observational units and variable in this study.
(b) State appropriate null and alternative hypothesis for considering whether there is convincing evidence that people are more likely to pick the correct set of photos than we would expect by random chance alone. You should so using symbols, defining the symbols you use.
(c) Use JMP and/or R (p. 37) to carry out a “binomial test” for your hypotheses in (b). Be sure to include appropriate evidence of input used and your output.
(d) Provide a detailed interpretation of the p-value from (c) in context. [Hint: Apply the lessons you learned about how to interpret probability, e.g., what is being repeated, what is happening, what are you assuming?]
(e) What conclusion can you draw from the p-value in (c)?
(f) Using the binomial model, how many standard deviations is the observed result from the expected value under the null hypothesis?
(g) Nakajima was so surprised by these results that he ran this study again, using 55 new students. Forty-two chose the correct list. Combine the results from these two studies together and find the p-value for the hypotheses in (b). (Include output.) Is the p-value larger or smaller than in (c)? Give an intuitive explanation for why the p-value is different in this way for the new results.
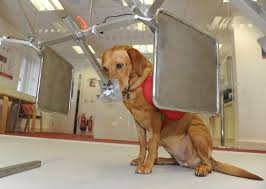
3) In 2011, an article published by the medical journal Gut—An International Journal of Gastroenterology and Hepatology (Sonoda et al.) reported the results of a study conducted in Japan in which a dog was tested to see whether she could detect colorectal cancer. The dog used was an eight-year-old black Labrador named Marine. (As her name might suggest, she was originally trained for water rescues.) The study was designed so that the dog first smelled a bag that had been breathed into by a patient with colorectal cancer. This was the standard that the dog would use to judge the other bags. Marine then smelled the breath in five different bags from five different patients, only one of which contained breath from a different colorectal cancer patient; the others contained breath from noncancer patients. The dog was then trained to sit next to the bag which she thought contained breath from a cancer patient (i.e., had the cancer scent). If she sat down next to the correct bag, she was rewarded with a tennis ball. Marine completed 33 attempts of this experimental procedure, with a different set of five patients each time: four noncancer patients and one cancer patient. And, each time, whether or not she correctly identified the bag with the breath of the cancer patient was recorded.
(a) Why is it important to use new patients each time? [Hint: How does this help us meet the binomial model?]
(b) Identify the observational units and variable of interest. Indicate which outcome you will consider “success.”
(c) Define the parameter of interest (in context).
(d) Using symbols, state appropriate null and alternative hypotheses for deciding whether Marine is able to identify the correct bag more than we would expect by chance alone.
In this study, Marine was correct in 30 of the 33 attempts.
(e) Use JMP and/or R to carry out a “binomial test” for your hypotheses in (d). Include relevant output.
(f) State appropriate null and alternative hypotheses for deciding whether Marine’s probability of correct identification differs from 3/4.
(g) Use JMP and/or R to carry out a “binomial test” for your hypotheses in (f). Include relevant output.
(h) Using
trial and error (feel free to use the One Proportion
Inference applet), find the smallest value of ![]() for which you would
first fail to reject the null hypothesis. [Hint: You are trying
additional value of
for which you would
first fail to reject the null hypothesis. [Hint: You are trying
additional value of ![]() in Ho, using two-sided p-values. You can use either
simulated or exact p-values.]
in Ho, using two-sided p-values. You can use either
simulated or exact p-values.]
(i) Using
trial and error (feel free to use the One Proportion
Inference applet), find the largest value of ![]() for which you would fail
to reject the null hypothesis.
for which you would fail
to reject the null hypothesis.
Possible
Extension Ideas (there is now a spot under Assignments for you to upload files)
· Follow-up on one of the referenced articles and summarize additional information in the article that you find interesting.
· Read https://parade.com/929476/marilynvossavant/how-well-can-dogs-detect-cancer/ and discuss how it relates to the material we are discussing in class
· Upcoming Stat talks
o Monday, 4-5pm, 35-209 (Research)
o Tuesday, 11-12pm, 38-121 (Teaching demo)
o Wednesday, 4-5pm, 33-285 (Research)
o Thursday, 11-12pm, 38-121 (Teaching demo)
Project 1: You should also start brainstorming ideas for Project 1. In particular, have you heard a “claim” recently that could be tested with a binomial model?