Stat 301 – HW 1
Due noon, Friday, Jan. 10
The homework assignment below is to be submitted by noon on Friday. This does not mean wait until Thursday night to start! (You can bring a hard copy to class Thursday or to my office Friday (slide under my door), or upload into Canvas by Friday (If you upload your assignment, please upload separate files for problems 2, 3, and 4. You should also use Word or PDF format only.)
1) Initial course survey in PolyLearn
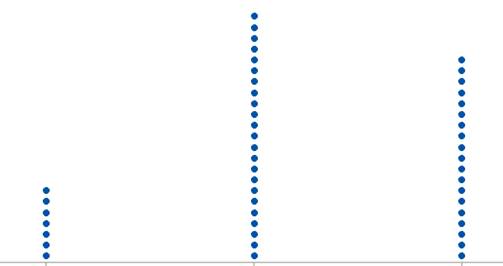
2) Below some
variables (mostly answers to questions from Initial Course Survey for the first
50 respondents this quarter) and some graphs. Your task will be to identify
which graph belongs to which variable. You will be graded on your justification
more than the correctness of your matches.
· Heights of students in a past 301 class
· Number of siblings
· Number of states
visited
· Political inclination (conservative,
moderate, or liberal)
· Amount of change in pockets (dollar amount)
· Coke or Pepsi preference
· Mac or PC user
· Number of heads reported in 50 tosses of a
coin
· Cost of last hair cut in a past 301 class
· Ratings of the value of statistics on a scale
of (1)-(9)
|
(a)
|
(b)
|
|
(c)
|
(d)
|
|
(e)
|
(f)
|
|
(g)
|
(h)
|
|
(i) |
(j)
|

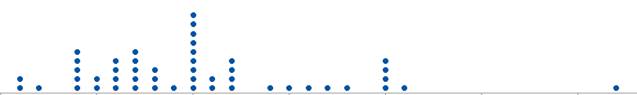
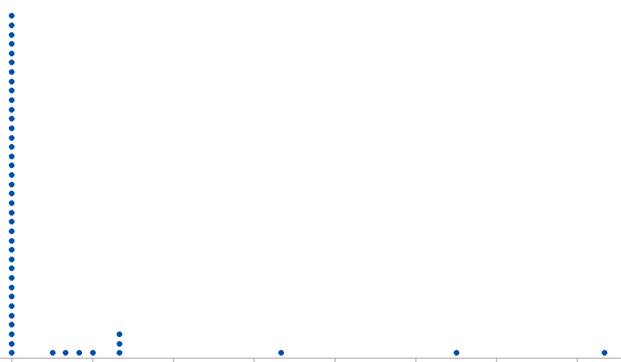
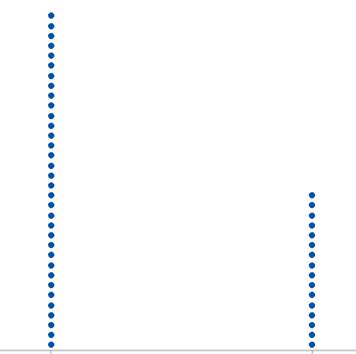


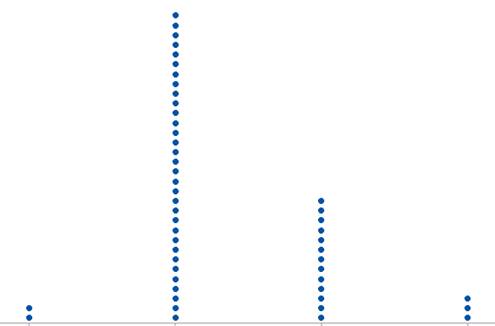


Write a paragraph explaining how you decided
which graph belonged with which variable.
(You can cite “process of elimination” for at most one graph but should
give justifications for the others, clearly state any assumptions you make
along the way. For example, you might consider whether reasonable numerical
values can be placed along the horizontal axis as well as what shape you expect
the distribution to have.)
3) Reconsider what you learned about the definition of probability from the Investigation B. Use the same long-run relative frequency interpretation of probability to interpret what we mean by “probability” in the following (Hint: Don’t use the words probability, chance, or likelihood in your interpretation):
(a) The probability of getting a red M&M candy is .2. [Hint: For
20% of …. What happens? …]
(b) The probability of a four-of-a-kind in a five-card poker hand is 0.0240%.
(c) There is a 30% probability of rain tomorrow.
(d) I heard that Clemson has a 53% chance of winning the game against
LSU.
4) People use animals to predict outcomes
of sporting events and elections mostly by having the animals pick between two
containers of food, each representing one of the two teams or the two candidates
involved. Probably the most famous of these is Paul the Octopus from Germany
who was correct in all eight of his predictions for the 2010 World Cup. Do his
results provide strong evidence that Paul is doing something other than
randomly guessing and perhaps has some psychic power?
(a) Can we use a “coin tossing” simulation to represent the
scenario where Paul is simply guessing? Explain
(and discuss any limitations you see in using this model to represent Paul’s
behavior).
(b) If we let ![]() represent
Paul’s probability of picking the winning team, what is the value of
represent
Paul’s probability of picking the winning team, what is the value of ![]() if Paul is
randomly guessing?
if Paul is
randomly guessing?
(c) If Paul has some psychic power, what does this imply about
the value of ![]() ?
?
(d) Use the One Proportion
Inference applet to find a p-value. Include
a copy of your computer results (e.g., screen capture)
showing both the input values and the results.
(e) Interpret this p-value in the
context of the study (what is it the probability of?)
(f) Based on your p-value, write out a conclusion in
the context of the research question.
(g) As was stated earlier, many animals are used to
predict outcomes of sporting events with most of them not doing any better than
random chance and therefore not getting much publicity. Paul made the news
because he was so accurate. Do you think it is surprising that some animal
would be very successful like Paul was? Explain.
(h) Do these data provide convincing evidence that
Paul’s probability of picking the winning team is larger than 0.70?
Justify your conclusion.
Possible Extension assignment entries
·
Find another
study of an animal used to predict outcomes of sporting events. Discuss
the results.
·
Attend
Statistics job candidate talks and write a brief paragraph summarizing what you
learned:
o
Thursday
4:10-5:00 (38-136)
o
Friday
11:10-12 (38-121)
o
Monday
4:10-5:00 (35-209)
o
Tuesday
11:10-12 (38-121)
· Post any helpful
technology hints to the course discussion board