Stat 217 – Review 1
Problems
1) Suppose that the observational units in a study are the
patients arriving at an emergency room in a given day. For each of the
following, indicate whether it can legitimately be considered a variable or
not. If it is a variable, classify it as categorical (and if it is binary) or
quantitative. If it is not a variable, explain why not.
a. Blood type
b. Waiting time
c. Mode of arrival (ambulance, personal car, on foot, other)
d. Whether or not men have to wait longer than women
e. Number of patients who arrive before noon
f. Whether or not the patient is insured
g. Number of stitches required
h. Whether or not stitches are required
i. Which patients require stitches
j. Number of patients who are insured
k. Assigned room
number
2) Tennis players often spin a tennis
racquet, and observe whether it lands with the logo facing up or down, to
determine who serves first. But is this
really a 50-50 process, equally likely to land with the logo facing up or
down? To investigate this, a tennis
player spun his racquet 100 times, and he obtained 46 “up” and 54 “down”
results. Does this provide much evidence
against believing that spinning the racquet is really a fair 50-50
process?
a. Produce a
graph of these sample results. Identify
the statistic and use an appropriate symbol to represent it.
b. Define the
parameter of interest in words.
c. State the
null and alternative hypotheses corresponding to this research question.
d. Describe how
you could use a coin to conduct a simulation analysis of this study and its
result.
Give
sufficient detail that someone else could implement this simulation analysis
based on your description. Be sure to
indicate how you would decide whether the observed data provide much evidence
against believing that spinning the racquet is really a fair 50-50 process.
e. Which graph
below could represent our null distribution? Explain.
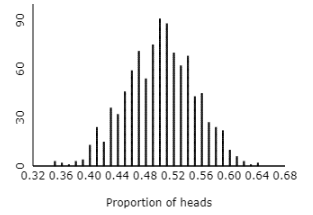
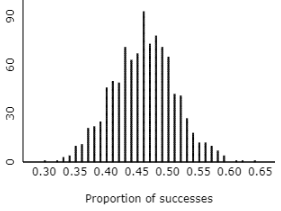
f. What conclusion do you draw from the null distribution? Is there convincing evidence against the
belief that spinning the racquet this way is a fair 50/50 process? Explain your reasoning.
3) Findings at James Madison University
indicate that 21% of students eat breakfast 6 or 7 times a week. A similar question was asked of a random
sample of 159 Cal Poly students. Of the 97 who responded, 35 reported eating
breakfast 6 or 7 times a week. Is this
convincing evidence that Cal Poly students have healthier breakfast habits than
James Madison students? More
specifically, do more than 21% of all Cal Poly students eat breakfast 6 or 7
times weekly?
a. Define the population of interest and the sample being
considered.
b. Define the parameter and the statistic
for this study.
c. The p-value
turns out to be around 0.001. What
conclusion would you draw from this p-value?
d. Provide an interpretation
of this p-value as if to someone not taking a statistics class.
e. If you took
another random sample of 159 Cal Poly students, which of your answers to part b
would change?
f. What are
your thoughts about the fact that only 97 out of the original random sample of
159 responded?
g. Suppose you
plan to conduct a new study with a simple random sample of 1,590 Cal Poly students.
Explain how you could obtain this sample.
h. Would this
new sample size address the issue you identified in part f?
i. How would
you expect this p-value in part c to change if of the 1,590 Cal Poly students
you sample 36% reported eating breakfast 6 or 7 times a week (larger, smaller,
or about the same)? Explain (without finding a new p-value!).
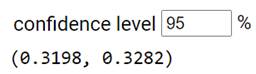
4) Return to the tennis
racquet study:
a. Do you expect the normal approximation (aka
Central Limit Theorem) to apply to this study?
The following computer output determines a 95%
confidence interval for the probability a racquet lands up based on these
results.
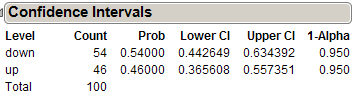
b. Interpret this 95% confidence interval in
context.
c. How do you expect the confidence interval to
change if the sample size was 200 and the sample proportion was still .46?
d. Based on your analyses, would it be
legitimate to conclude that the
probability a spun tennis racquet lands up is .5? Discuss both the validity of this conclusion based
your analyses and what it means to say “probability” in this context.
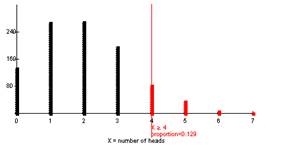
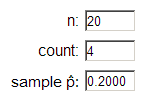
5) A sample of twenty Dordt College
students is taken, four of whom (4/20=20%) say they study at least 35 hours per
week during the academic year. At most state universities, the proportion of
students who report studying at least 35 hours a week is 10%. We wish to see
whether the Dordt sample provides strong evidence that the true proportion of
Dordt students who study more than 35 hours a week is more than 10%.
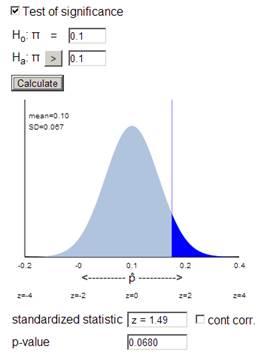
Two different approaches were taken in order to yield a
p-value.
Option #1. 1000 sets of 20 “coin
tosses” were generated where the probability of heads was 10%. Out of the 1000
sets of tosses 129 sets had at least 4 heads occur, and so a p-value of 0.129
is obtained, showing little evidence that more than 10% of Dordt students study
more than 35 hours a week.
Option #2. The Theory-Based Inference
applet was used, generating a z-score of 1.49 with a p-value of 0.068, yielding
moderate evidence that more than 10% of Dordt students study more than 35 hours
a week.
|
One Proportion applet results (Option
#1)
|
Theory Based Inference Applet (Option
#2)
|
Briefly explain which p-value (Option #1 or Option #2) is
more valid and why.
Note:
Although the results obtained from the One Proportion applet are subject to
some variation because it is based on simulation that is NOT the main reason
for the discrepancies between the two p-values.
6) In a 1993 study, researchers took a
sample of people who claimed to have had an intense experience with an
unidentified flying object (UFO) and a sample of people who did not claim to
have had such an experience (Spanos et al., 1993). They then compared the two
groups on a wide variety of variables, including IQ. Suppose you want to test
whether or not the average IQ of those who have had such a UFO experience is
higher than 100, so you want to test H0: μ = 100 vs. Ha: μ > 100.
a. Identify
clearly what the symbol μ represents in this context.
b. Is this a one-sided
or a two-sided test? Explain how you can tell.
The sample mean
IQ of the 25 people in the study who claimed to have had an intense experience
with a UFO was 101.6; the standard deviation of these IQs was 8.9.
c. Does this
information enable you to check the technical conditions completely? What needs
to be true for this procedure to be valid?
d. Calculate
the test (standardized) statistic and draw a sketch with shaded area
corresponding to obtaining a test statistic as extreme or more extreme than
this one observed for the sample of 25 UFO observers.
e. Estimate the
value of the p-value from your sketch.
f. Write a
sentence interpreting the p-value in the context of this sample and these
hypotheses. Summarize the conclusion of your test in context.
7) The 2004 General Social Survey (GSS)
interviewed a random sample of adult Americans. For one question the
interviewer asked: “From time to time, most people discuss important matters
with other people. Looking back over the last six months–who are the people
with whom you discussed matters important to you? Just tell me their first
names or initials.” The interviewer then recorded how many names or initials
the respondent mentioned. Results are tallied in the following table.
|
Number of
Close Friends |
0 |
1 |
2 |
3 |
4 |
5 |
6 |
Total |
|
Count (Number of Respondents) |
397 |
281 |
263 |
232 |
128 |
96 |
70 |
1467 |
A histogram of the data:
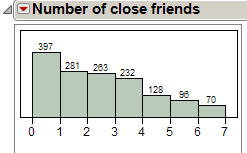 mean = 1.987 friends, SD = 1.7708
friends
mean = 1.987 friends, SD = 1.7708
friends
a. Identify the
observational units and variable in the study. Is the variable categorical or
quantitative?
b. This
distribution is sharply skewed to the , but a t-interval is
still valid. Explain why.
c. Use the 2SD approach
to approximate a 95% confidence interval for the mean number of close friends
in the population of American adults.
d. Which two of
the following are reasonable interpretations of this confidence interval and
its confidence level:
- You can be 95% confident that the
mean number of close friends in the population is between the endpoints of
this interval.
- Ninety percent of all people in
this sample reported a number of close friends within this interval.
- If you took another sample of 1467
people, there is a 95% chance that its sample mean would fall within this
interval.
- If you repeatedly took random
samples of 1467 people, this interval would contain 95% of your sample
means in the long run.
- If you repeatedly took random
samples of 1467 people and constructed t-intervals in this same manner,
95% of the intervals in the long run would include the population mean
number of close friends.
- This interval captures the number
of close friends for 95% of the people in the population.
e. For one of
the incorrect interpretations in part d, explain why it is incorrect.
f. Describe how
the interval would change if all else remained the same except
•
The sample size was larger.
•
The sample mean was larger.
•
The sample values were less spread out.
•
Every person in the sample reported one more close friend.
8) A national survey of 47,000 American
households in 2006 found that 32.4% of the households included a pet cat. Assume
this is a representative sample of American households. Consider the following
output.
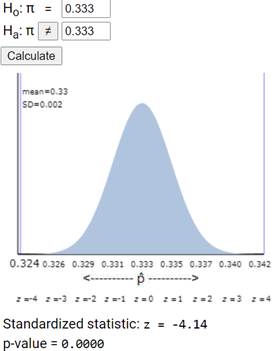
(a) Identify the sample and the population
in this context.
(b) Write a one-sentence interpretation
of the value z = -4.14 in this context.
(c)
Based
on this output, is there convincing evidence that the proportion of all
American households that include a pet cat diffs from 1/3?
(d) Based on this output, is there evidence
that the population of all American households that include a pet cat is much
different from 1/3?