· Choose Tools > Options
· Click the + next to Session Window
· Select Submitting Commands
· Select the Command Language Enable button.
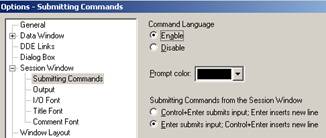
Minitab Hints
To “permanently” enable the command language:
· Choose Tools > Options
· Click the + next to Session Window
· Select Submitting Commands
· Select the Command Language Enable button.
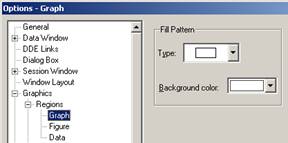
To change the graph background
from tan to white:
· Choose Tools > Options
· Click the + next to Graphics
· Select Regions > Graph
· Change the Fill Pattern Background color to white.
Note: To eliminate the background color in Excel, double click on the background and change the Area color to “None.”
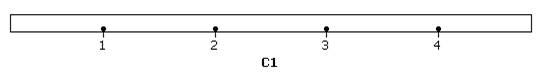
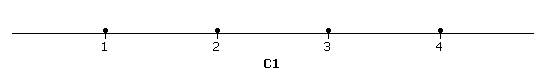
To remove axis lines and scales in a graph:
· Double click on the line you want to remove, the appropriate Edit window should appear.
· Choose the Show tab
· Unselect any lines, ticks, and tick labels you do not want to appear.
Example: the following dotplots are with and without the “high” horizontal axis line and the low/high vertical scale axis lines.
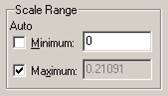
To force the vertical
axis to start at zero in a scatterplot:
· Create the scatterplot
· Double click on the vertical axis scale to pull up the Edit Scale menu
·
In the
This is especially useful for creating graphs of density functions. To create pdf’s, use the “Connect line” option (select Data View > Data Display). To create pmf’s, use the “Project lines” option. To shade areas under a pdf curve, use the Polygon subcommand (might be easiest through the command language).
To change the number
of bins in a histogram or changing scaling in a graph
· Double click on one of the numbers in the axis scale to bringup the Edit Scale box
· Click Binning and change the value in the Number of intervals box
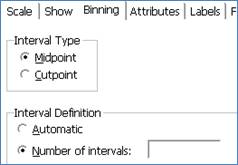
You can also change from midpoints to cutpoints, the number of tick marks etc.
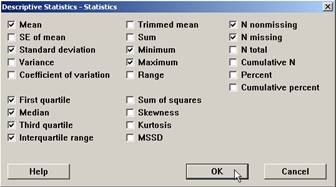
To determine which
descriptive statistics are displayed:
· Choose Stat > Basic Statistics > Display Descriptive Statistics
· Click the Statistics button
· You can now select and un-select which statistics are displayed when the describe command is used.
In the Data window, to control whether the cursor moves right or down when you hit Enter:
Click on the arrow in the upper right corner of the Data window to toggle between these options.

To return directly to
the previous menu window:
Choose the Edit Last Dialog menu icon,
![]()
Minitab 13 Commands
To create boxplots on the same scale, choose Graph > Boxplot. Specify the (stacked) response variable as the Y variable and the categorical grouping variable as the X variable. To transpose, click the Options button and check the Transpose X and Y box.
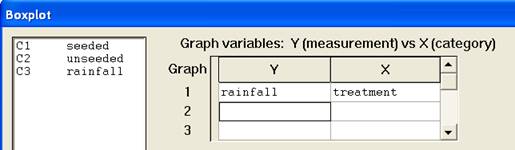
Note: If the variables are not stacked, you will need to stack them first.
To create dotplots, choose Graph > Dotplot. Specify the (stacked) response variable in the variables box, select the By variable button, click in the box and then specify the categorical grouping variable.
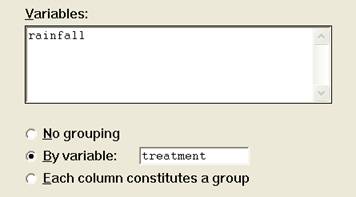
Or enter the two (unstacked) group results and select the “Each column constitutes a group” button.
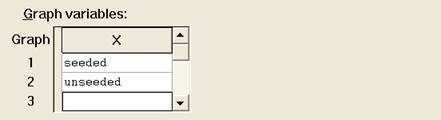
To create a histogram, choose Graph > Histogram. Specify the individual group results in the Graph variables area.
You can use the Annotation menu to select “Data Labels”:
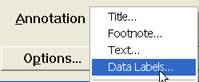
and then check the “Show data labels” box.
You can use the Frame pull-down menu to select “Multiple Graphs”:
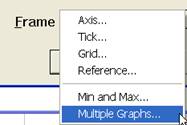
and then select the “Overlay graphs on the same page” button.
To create a probability plot, choose Graph > Probability Plot and double click on a variable to enter it into the Variables box. You will have to create the plot using the Distribution pull-down menu to change the fitted distribution. You also cannot overlay a distribution fit on a histogram.
Using the One-Sample and Two-sample t-procedures: These will work similarly, but you will not have the option of using only summary data. You must have opened a data file of the raw data.
To carry out a chi-square test if the raw data are contained in different columns, choose Stat > Tables > Cross Tabulation. Check the box that says “Chi-Square Analysis.”