Example: Fish Oil and
Blood Pressure
Researchers randomly assigned 14 male volunteers with high
blood pressure to one of two diets for four weeks: a fish oil diet and a
regular oil diet. The subjects’
diastolic blood pressure was measured at the beginning and end of the study,
and the reduction was recorded for each subject (taken from The Statistical Sleuth, based on a study
reported in the New England Journal of
Medicine in 1999). Prior to
conducting the study, researchers conjectured that those on the fish oil diet
would tend to experience greater reductions in blood pressure than those on the
regular oil diet. The resulting
reductions in diastolic blood pressure, in millimeters of mercury, were:
Fish oil
diet: 8 12 10 14 2 0 0
Regular oil
diet: -6 0 1 2 -3 -4 2
(a) Discuss the design of how this study was conducted.
(b) Produce and discuss graphical and numerical summaries of
these data.
(c) Conduct a simulation to address the issue of statistical significance: do these data provide strong
evidence that those on the fish oil diet experienced a greater reduction in
blood pressure? Conduct one analysis to
compare the mean reduction and another to compare the median reduction.
(d) Summarize the conclusions that you can draw from this study, and explain the reasoning process behind them.
Analysis:
(a) This is a controlled, randomized experiment because the researchers randomly assigned the explanatory variable (type of oil) to the subjects. The response variable, the reduction in blood pressure, is quantitative. The random assignment was necessary to prevent variables. In other words, the randomization tends to balance out other variables that might influence blood pressure between the two groups. The subjects were all male volunteers with high blood pressure, so we might want to be cautious about generalizing conclusions to include women or those with normal blood pressure.
(b) The following dotplots reveal
the distributions of blood pressure reductions between the two groups:

These dotplots reveal that the blood pressure reductions are generally higher among those on the fish oil diet. Some descriptive statistics for comparing these groups include:
Variable oil
N Mean StDev Minimum
Q1 Median Q3
Maximum
BP
reduction fish 7
6.57 5.86 0.00
0.00
8.00 12.00 14.00
regular 7
-1.14 3.18 -6.00
-4.00 0.00 2.00
2.00
The mean blood pressure reduction for the
fish oil group exceeds that of the regular oil group by 7.71 millimeters, and
the median is higher by 8 millimeters.
There is also more variability in the blood pressure reductions in the
fish oil group (SD: 5.86 vs. 3.18, IQR: 12 vs. 6 millimeters).
(c) A Minitab simulation of 1000
randomizations of these data can be conducted using a macro such as the
following:
sample 14 c2 c3
unstack c1 c4 c5;
subs c3.
let
c7(k1)=median(c4)-median(c5)
let k1=k1+1
One simulation produced the following
distribution of differences in group means (fish oil group minus regular oil
group):
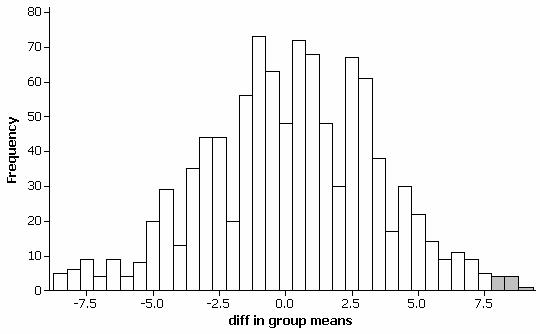
Notice that this
distribution is symmetric and centered around 0 as we would expect when there
is no true difference between the two groups. Only 11 of these 1000 randomizations produced
a difference in group means of 7.71 or higher, so the empirical p-value is 11/1000
= .011. When we analyze the difference
in medians rather than the difference in means, we obtain:
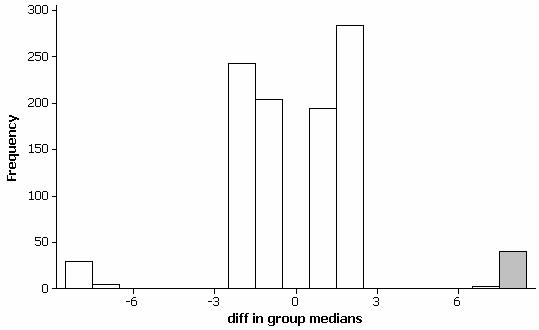
This distribution is
also fairly symmetric and centered around 0, but it contains unusual dips and
gaps, because with such small samples there are only a few possible values for
the group medians. Of these 1000
randomizations, 40 produced a difference in group means of 8 or higher, so the
empirical p-value is 40/1000 = .040.
(d) Both of these
p-values are quite small (e.g., both below .05),
indicating that a difference at least as extreme as
that found in the actual experiment would be unlikely to occur by chance
alone, if there were no difference between the fish oil and regular oil
groups. We can therefore conclude that
the differences observed in the experiment are statistically significant. The experimental data provides strong
evidence that the fish oil diet produces higher blood pressure reductions on
average than the regular oil diet.
Because the data were collected from a randomized experiment, we can
conclude that there is strong evidence of a causal relationship between the
type of oil and blood pressure reduction.
But because the subjects were all male volunteers with high blood
pressure, we should be cautious about generalizing this conclusion to women or
to those with normal blood pressure.