Example 5.1: Worries
about Terrorist Attacks
A
2004 Harris Interactive poll asked respondents “How often do you worry about the possibility of a terrorist attack in
this country?” Parallel surveys were conducted online of a “nationwide
cross-section” of adults over the age 18 in the
(a) Carry out a test of significance
(including all steps) to determine whether the difference in these sample
proportions is statistically significant.
What conclusion does the test allow you to draw about the population
proportions who don’t worry much or at all about terrorist attacks?
(b) The responses to two other survey
questions are given below. Without
calculating, would the p-values for each of these comparisons be larger or
smaller to the p-value in (a)?
|
|
US |
|
|
"How likely do you think it is
that there will be a major terrorist attack in this country in the next
twelve months?" |
62%
thought likely |
64%
thought likely |
|
"How much confidence do you
have in the ability of the government to reduce the likelihood of a terrorist attack?" |
72%
greatly or somewhat confident |
54% greatly
or somewhat confident |
(c) The Harris Interactive website included
the following statement:
In theory, with probability samples
of this size, one could say with 95 percent certainty that the results
have a statistical precision of plus or
minus 1.7 percentage points (in the
calculations of sampling error. They include
refusals to be interviewed (non-response), question
wording and question order, and weighting.
It is impossible to quantify the errors that may result from
these factors. This online sample is not a
probability sample.
- Where do the “1.7 percentage points” and “2 percentage points” figures come from?
- Why do you think they state that this online sample is not a probability sample?
Analysis:
(a) The response variable is categorical and binary. Suppose we define “success” as “not worrying much or at all about a terrorist attack in their country.” Then we can let pUS –pUK represent the difference in the population proportions that would respond that they don’t worry much or at all.
H0: pUS –pUK = 0 (there is no difference in the population proportions)
Ha: pUS –pUK ≠ 0 (there is a difference)
Note: We were not given a conjectured direction as to which country would have a higher population proportion.
Since these polls were conducted separately in the two countries, the samples are independent. However, as discussed in (c), they are not true random samples, so we need to have some caution in generalizing these results to all adults over the age of 18 in the two countries.
The sample sizes were large (over 900 successes and failures in each sample) so the normal distribution would be a reasonable model for the sampling distribution of the difference in sample proportions if the samples were randomly selected.
Using this normal distribution model, we would expect the distribution of the difference in sample proportions to be centered at zero. Assuming that the null hypothesis of equal population proportions is true, our estimate of the standard deviation of this distribution is
 = .0132
where .433 = (1520+991)/(3378+2417), the pooled estimate of the proportion of successes.
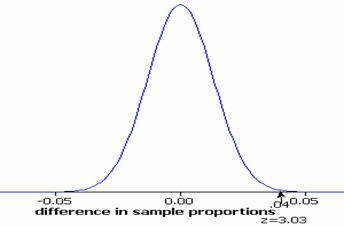
With this standard error, the observed difference in the sample proportions (.45-.41=.04) is 3.03 standard errors from the hypothesized difference of zero:
![]()
=3.03
The probability of observing a test statistic at least this extreme (in either direction) by random sampling alone is p-value = 2P(Z>3.03) = 2(.0012) = .0024.
These calculations (apart from rounding discrepancies) are confirmed by Minitab and the Test of Significance Calculator java applet:
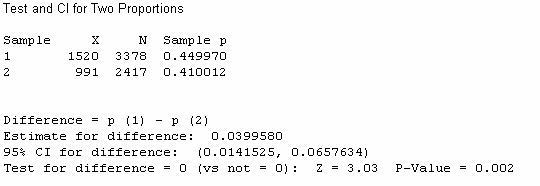
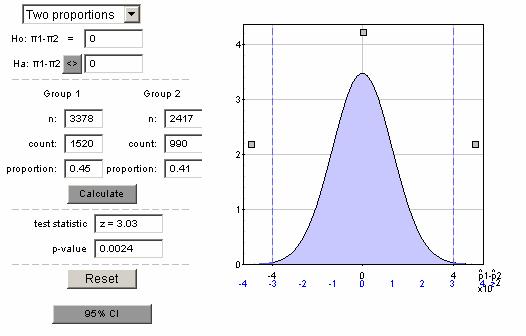
With such a small p-value (e.g., less than .01), we reject the null hypothesis. If the population proportions had been equal, this tells us that there is a very small probability of random sampling alone leading to sample proportions at least as far apart as those found by Harris. Therefore, we have strong evidence that the population proportions who worry little or not at all about terrorist attack is not the same in the US and UK.
A 95% confidence interval for the difference in the population proportions is (.014, .066). So we are 95% confident that 1.4% to 6.6% more of all Americans than all Britons are not worried about terrorist attack. This is not a large difference in a practical sense, but we don’t believe a difference in sample proportions this large could have arisen by random sampling alone (in particular due to the large sample sizes).
(b) Since the sample sizes are the same but the difference
in sample proportions would be smaller, the p-value for the “likelihood of
attack” question would be larger. On the
other hand, since the sample proportions are further apart for the “confidence in
government to prevent attacks” question, the p-value would be even smaller.
Thus, there would be more evidence that the populations of Americans and
Britons differ in their opinions about government control over terrorism, but
less evidence that they differ in their expectations for an attack.
(c) If we assume a population proportion of around .5, then
for the
1.96![]() = .0169.
= .0169.
The margin of error for the
1.96![]() =.0199.
=.0199.
If the population proportion turns out to be different from .5, the actual margin of error would be smaller (see HW exercise). Thus, these calculations give us quick approximations to the maximal margins of error.
The above interpretations (p-value, confidence level, margin of error) rely on the samples being randomly selected from each population, so Harris provides a warning that their sampling method is not by definition a probability sample. Because of this, we must have some cautions in generalizing these results to the larger populations (though the methods were at least similar in the two countries). Still, further investigation of Harris’ methodology (www.harrisinteractive.com/advantages/methodology.asp) reveals that they use many methods to “maintain the reliability and integrity in the sample” and the web is used as the response mechanism instead of say the telephone. This makes the Harris online poll much better than the ubiquitous “click here” non-scientific opinion polls found all over the web. So while we must always worry about nonsampling errors with any poll, these Harris polls can be considered as reliable as a telephone poll.