Example 4.1: Feeling Good (cont.)
The 2004 nationwide Harris poll surveyed 1016 adults by
telephone between October 14 and 17. One
question that had changed appreciably from previous years was whether Americans
feel good about the morals and values of Americans in general, with 55 percent
saying they did.
(a) Carry out a binomial test and confidence interval to
determine whether this is convincing evidence that a majority of American
adults feel good about the morals and values of Americans in general. Why is it appropriate to use the binomial
distribution with this study?
(b) Is the sample size large enough for the normal
approximation to the binomial to be valid?
(c) If so, what results would you obtain using the normal
probability model? How closely do they
match the binomial results?
Analysis:
(a) Binomial analysis:
Let p = proportion of adults nationwide that say they feel good about the morals and values of Americans in general
H0:
p = .50 (no more than half of adults nationwide feel good about
this issue)
Ha:
p > .50 (a majority of adults nationwide feel good about this
issue)
It is reasonable
to use the binomial model since we have a fixed number of trials (1016), a
random sample, two possible outcomes (agree or not agree), and a fixed
probability of success (p) We will treat the observations
as independent since the population of adult Americans is much larger than the
sample size.
Minitab
output:
Test and
CI for One Proportion
Test
of p = 0.5 vs p > 0.5
95%
Lower Exact
Sample X
N Sample p Bound
P-Value
1 559
1016 0.550197 0.523950
0.001
As well as determining a 95% confidence interval for p:
Exact
Sample X
N Sample p 95% CI P-Value
1 559
1016 0.550197 (0.519007,
0.581095) 0.002
These results indicate that .5 is not a plausible value for p (one-sided p-value » .001) and that we are 95% confident that between 51.9% and 58.1% of adults nationwide feel good about the morals and values of Americans in 2004.
(b) To decide whether the sample size is large enough to use
a normal (z) procedure, we want
to check whether np> 10 and n(1-p) >10. Since we don’t know the actual value of p, when we conduct the test of significance, we use the
conjectured value, .50.
1016(.5) = 508 > 10 Ö and 1016(1-.5) = 508 > 10 Ö
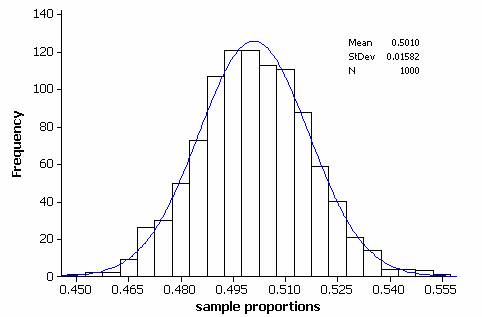
These conditions are easily met. In fact, we could simulate 1000 observations of a binomial random variable with parameters n=1,016 and p = .5, and we see the N(.5, .016) model fits the distribution of the sample proportions quite well:
(c) So it is valid to compute the test statistic and p-value using the normal distribution:
z = ![]() =3.20
=3.20
p-value = P(Z > 3.20) = 1-P(Z<3.20) = 1-.9993 = .0007 » .001
Cumulative
Distribution Function
Normal
with mean = 0 and standard deviation = 1
x
P( X <= x )
3.2 0.999313
This provides us with a very similar result as the exact Binomial
p-value (.001) but with the added benefit of reporting a test statistic (z=3.20) as another way to measure how
far (how many standard deviations) the observed sample proportion result is
from the hypothesized value of the population proportion.
To decide if it is valid to calculate a confidence interval
using the normal probability model as well, we would use the observed value of ![]() to check the technical conditions:
to check the technical conditions:
1016(.55) = 558.8 > 10 Ö and 1016(.45) = 457.2 > 10 Ö
Again, these are easily met and so the normal approximation is again valid. An approximate 95% confidence interval for p would be:
.55 +
1.96 ![]() = .55 + .03
= .55 + .03
We are (approximately) 95% confident that between 52% and 58% of adults nationwide feel good about their overall quality of life, very similar to the result from the binomial procedure.
The Minitab output corresponding to these normal procedures is below:
Test and
CI for One Proportion
Test
of p = 0.5 vs p > 0.5
95%
Lower
Sample X
N Sample p Bound
Z-Value P-Value
1
559
1016 0.550197 0.524525
3.20 0.001
Sample X
N Sample p 95% CI Z-Value P-Value
1 559
1016 0.550197 (0.519607,
0.580786) 3.20 0.001