Stat 414 – HW 8
Due midnight, Monday, Dec. 1
You don’t need to include R code I give you but should include R code you create/modify and relevant output. Please submit separate files for each question.
1) The U.S. National Longitudinal Study of Youth (NLSY) original study began in 1979 with a nationally-representative sample of nearly 13,000 young people aged 14 to 21. CurranData.txt contains data from a sub-study of children of the female NLSY respondents which began in 1986 when the children were aged between 6 and 8 years. Child assessments (e.g., reading scores) were then measured biennially in 1988, 1990 and 1992. The sub-sample of 221 children were assessed on all four occasions.
Read in two datasets. The first is in “wide format” and the second is in “long format.”
CurranDataWide <- read.delim("https://www.rossmanchance.com/stat414/data/CurranData.txt", "\t", header=TRUE)
head(CurranDataWide)
(a) Look at the first few rows in wide format. Which are time-varying variables and which are time-invariant?
(b) Examine the correlations of the reading scores across the four time points. (Explain what the R code is doing.) How would you summarize their behavior? Explain why the pattern in the covariation/ correlation makes sense in this context.
cor(select(CurranDataWide, contains("reading")))
CurranDataLong <- read.delim("https://www.rossmanchance.com/stat414/data/CurranData_Long.txt", "\t", header=TRUE)
head(CurranDataLong)
(c) Summarize what you learn from the “spaghetti plot” (pick one to include)
library(tidyverse)
ggplot(data = CurranDataLong, aes(y = RAscore, x = Time)) +
geom_line(aes(group=id), color="light grey") +
geom_smooth(aes(group=1), color="black", size=1) +
theme_bw() +
labs(x="Years since 1986", y="Reading Score")
OR
ggplot(CurranDataLong, aes(x = Time, y = RAscore, group = id)) +
geom_smooth(method = "loess", alpha = .5, se = FALSE) +
geom_smooth(aes(group=1), color="black") +
theme_bw()
(d) Use lme (not lmer) to fit a random intercepts longitudinal model (meaning, include Time).
1. Tell me about the variable Time (How has it been ‘parameterized’?)
2. Report the intra-class correlation coefficient.
3. What assumptions does this model make about the correlations of the four observations on each person? Does that assumption seem reasonable here?
library(nlme)
summary(model1 <- lme(RAscore ~ Time, random = ~1 | id, data = CurranDataLong))
cov2cor(getVarCov(model1, type="marginal")[[1]])
(e) Fit a random slopes model and examine the covariance matrix.
model2 = lme(RAscore ~ Time, random = ~Time|id, data = CurranDataLong)
summary(model2)
getVarCov(model2, type="marginal") #same for each subject (same time points)
cov2cor(getVarCov(model2, type="marginal")[[1]])
fits = fitted.values(model2)
ggplot(data = CurranDataLong, aes(y = fits, x = Time)) +
geom_line(aes(group=id)) +
theme_bw()
1. Verify the values for (Show me the numbers!)
· var(y11) = variance of “first observation” for person 1,
· var(y21) = variance of “second observation” for person 1 (which can differ because we are using random slopes),
· cor(1,2) = correlation of the first two measurements on each person,
· cor(1,3) = correlation of first and 3rd measurement on each person.
2. How are the variances changing over time? How do the correlations change as the observations get further apart?
(f) Return to the basic two-level random intercepts model with time and time2 as Level 1 variables, but without random slopes. Fit the AR(1) error structure.
model4 = lme(fixed = RAscore ~ Time + I(Time*Time), random = ~1| id, correlation = corAR1(), data = CurranDataLong)
summary(model4); intervals(model4)
cov2cor(getVarCov(model4, type="marginal")[[1]])
model5 = lme(fixed = RAscore ~ Time + I(Time*Time), random = ~1| id, data = CurranDataLong)
anova(model5, model4)
Is the model with the AR(1) structure significantly better than the “independent errors” random intercepts model?
(g) What is the estimated parameter of the AR(1) model (“autocorrelation”). How do you interpret it? Does there appear to be correlation between adjacent observations even after conditioning on student?
(h) How would we decide whether the pattern of growth (i.e., reading progress) differs between males and females? Explain the process, you don’t have to carry out.
2) Hox, Moerbeek, and Van de Schoot (2017) gave simulated data from a hypothetical study on stress in hospital (nurses.sav) as an example of a cluster-randomized experiment. In each of 25 hospital, four wards are selected and randomly assigned to either an experimental or a control condition. In the experimental condition, a training program is offered to all nurses to cope with job-related stress. After the program is completed, a sample of about 10 nurses from each ward is given a test that measures job-related stress. Additional variables (covariates) are: nurse age (years), nurse experience (years), nurse gender (0=male, 1 = female), type of ward (0=general care, 1=special care), and hospital size (0=small, 1 = medium, 2=large).
(a) Identify the levels in this dataset, including a schematic of the multilevel nature. Also identify the variables measured at each level.
(b) Why is this an example of a “cluster-randomized experiment”?
Load in the data
#install.packages("haven")
nurses <- haven::read_spss("https://raw.githubusercontent.com/MirjamMoerbeek/Data_Sets_ML_book/main/Nurses.sav") |>
as_factor()
#for simplicity later
nurses <- nurses |>
mutate(expcon_num = ifelse(expcon == "experiment", 1, 0))
Fit the random intercepts only model (see also Section 4.9)
summary(m0 <- lmer(stress ~ 1 + (1 | hospital / ward), data = nurses, REML = TRUE))
(c) Show how you might write out the
corresponding mathematical model (Hint: ![]()
(d) According to the fitted model,
(i) what is the estimated total variance in job-related stress?
(ii) What percentage of the total variance is at the ward level?
(iii) What percentage of the total variance is at the hospital level?
Note: these calculations are sometimes referred to as the “variance partitioning coefficients.”
For the “intraclass correlation,” we need to consider what information is shared by the responses.
·
Two Level 1 units in
the same Level 3 group (but different Level 2 groups): ![]()
·
Two Level 1 units in
the same Level 2 (and therefore Level 3 group): ![]()
We interpret the second one as the correlation of two Level 1 units in the same Level 2 unit.
(e) Compute these two ICC values (show your work) for two nurses in the same ward and between two nurses in the same hospital.
(f) Which is larger? Does this make sense conceptually? Explain.
(g) Does performance::icc(m0, by_group = T) give you the VPC or the ICCs?
(h) Estimate the intraclass correlation between two wards in the same hospital.
(i) Fit a model that decide whether the experimental intervention significantly lowers stress after adjusting for age, gender, experience, ward type, and hospital size. What do you conclude? (Include supporting output.)
(j) Expand your model to see whether the experimental effect substantially varies across hospitals. What do you conclude? (Include supporting output and document your steps) (Hint: To model random slopes of a level 2 variable across level 3 groups, do that separately from the random intercepts)
(k) Expand your model to see whether a significant amount of the variation in the experimental effect across hospitals can be explained by hospital size, describing the nature of the interaction (which types of hospitals have a larger experimental effect).
3) Several research studies have explored the hypothesis that teachers’ expectations influence pupils’ intellectual development. In this exercise you will combine results across 19 different experiments. In these studies, the treatment was whether or not teachers were encouraged to have “high” expectations.
|
study |
Author |
year |
weeks |
setting |
tester |
n1 |
n2 |
Cohen’s d |
SE of diff |
|
1 |
Rosenthal et al. |
1974 |
2 |
group |
aware |
77 |
339 |
0.03 |
0.125 |
|
2 |
Conn et al. |
1968 |
21 |
group |
aware |
60 |
198 |
0.12 |
0.147 |
|
3 |
Jose & Cody |
1971 |
19 |
group |
aware |
72 |
72 |
-0.14 |
0.167 |
|
4 |
Pellegrini & Hicks |
1972 |
0 |
group |
aware |
11 |
22 |
1.18 |
0.373 |
|
5 |
Pellegrini & Hicks |
1972 |
0 |
group |
blind |
11 |
22 |
0.26 |
0.369 |
|
6 |
Evans & Rosenthal |
1969 |
3 |
group |
aware |
129 |
348 |
-0.06 |
0.103 |
|
7 |
Fielder et al. |
1971 |
17 |
group |
blind |
110 |
636 |
-0.02 |
0.103 |
|
8 |
Claiborn |
1969 |
24 |
group |
aware |
26 |
99 |
-0.32 |
0.220 |
|
9 |
Kester |
1969 |
0 |
group |
aware |
75 |
74 |
0.27 |
0.164 |
|
10 |
Maxwell |
1970 |
1 |
Indiv |
blind |
32 |
32 |
0.8 |
0.251 |
|
11 |
Carter |
1970 |
0 |
group |
blind |
22 |
22 |
0.54 |
0.302 |
|
12 |
Flowers |
1966 |
0 |
group |
blind |
43 |
38 |
0.18 |
0.223 |
|
13 |
Keshock |
1970 |
1 |
Indiv |
blind |
24 |
24 |
-0.02 |
0.289 |
|
14 |
Henrikson |
1970 |
2 |
Indiv |
blind |
19 |
32 |
0.23 |
0.290 |
|
15 |
Fine |
1972 |
17 |
group |
aware |
80 |
79 |
-0.18 |
0.159 |
|
16 |
Grieger |
1970 |
5 |
group |
blind |
72 |
72 |
-0.06 |
0.167 |
|
17 |
Rosenthal & Jacobson |
1968 |
1 |
group |
aware |
65 |
255 |
0.3 |
0.139 |
|
18 |
Fleming & Anttonen |
1971 |
2 |
group |
blind |
233 |
224 |
0.07 |
0.094 |
|
19 |
Ginsburg |
1970 |
7 |
group |
aware |
65 |
67 |
-0.07 |
0.174 |
To compare different studies, you need
to use a “standardized difference” or “effect size.” Cohen’s d is like
the t-statistic but doesn't use sample sizes, ![]() .
The above table reports the Cohen’s d values and their associated
standard errors. Alas it is rare for studies to provide access to the raw data
and we must rely on the effect size reported (and then different packages in
R), so then we convert each study to the same effect size measure as was done
here. This also allows us to use the reported SE’s of the effects to measure
the Level 1 residual variance (to estimate
.
The above table reports the Cohen’s d values and their associated
standard errors. Alas it is rare for studies to provide access to the raw data
and we must rely on the effect size reported (and then different packages in
R), so then we convert each study to the same effect size measure as was done
here. This also allows us to use the reported SE’s of the effects to measure
the Level 1 residual variance (to estimate ![]()
(a) Do the effect sizes appear similar across the studies?
So now we want to estimate the true effect of teacher expectations.
(b) Which one or two of these studies would you consider the most reliable?
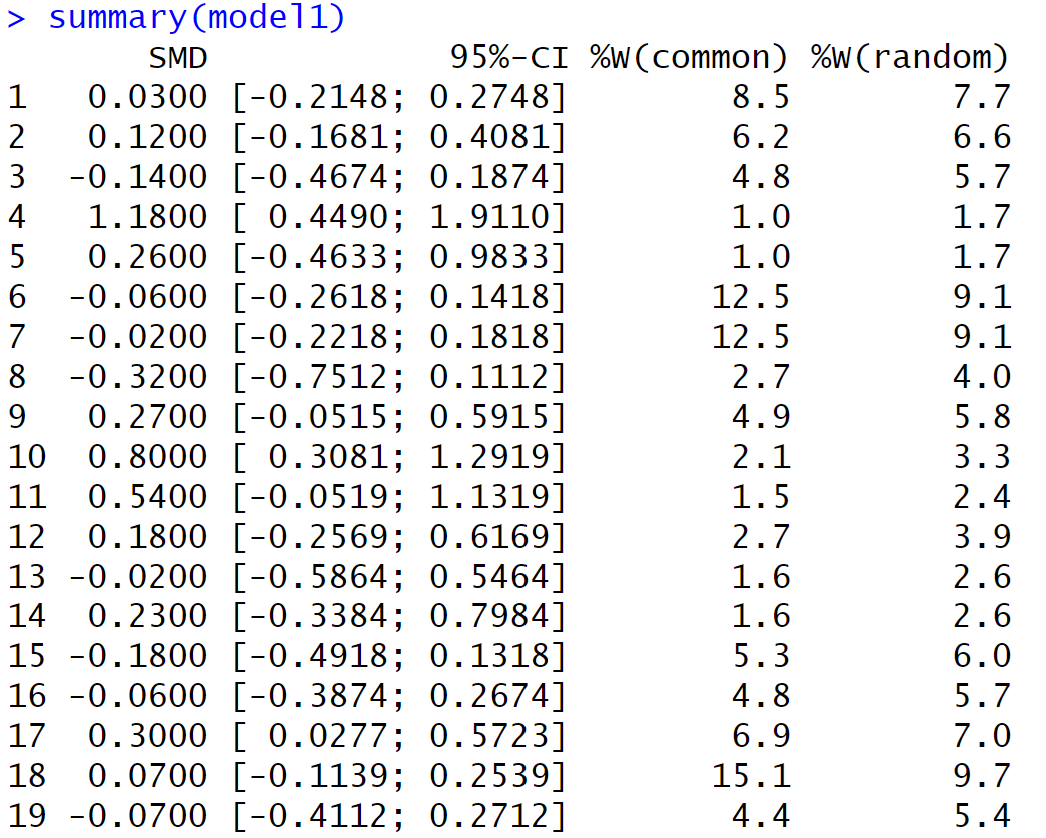
(c) Use the metagen package to generate output for a meta-analysis of these studies.
bryk = read.table("https://www.rossmanchance.com/stat414/data/bryk.txt", header=TRUE)
bryk$se = sqrt(bryk$var)
bryk$weeks.b <- ifelse(bryk$weeks > 1, 1, 0) #we will use this variable later
install.packages("meta"); library(meta)
model1 <- metagen(TE = diff,
seTE = se,
studlab = study,
data = bryk,
sm = "SMD", #we are working with standardized mean differences
method.tau = "REML",
method.random.ci = "HK"
)
summary(model1) #output below
(d) The output first reports the weight (as a percentage) given to each study (for both fixed effects and random effects). Which study is given the most weight? Is this what you expected? Explain.
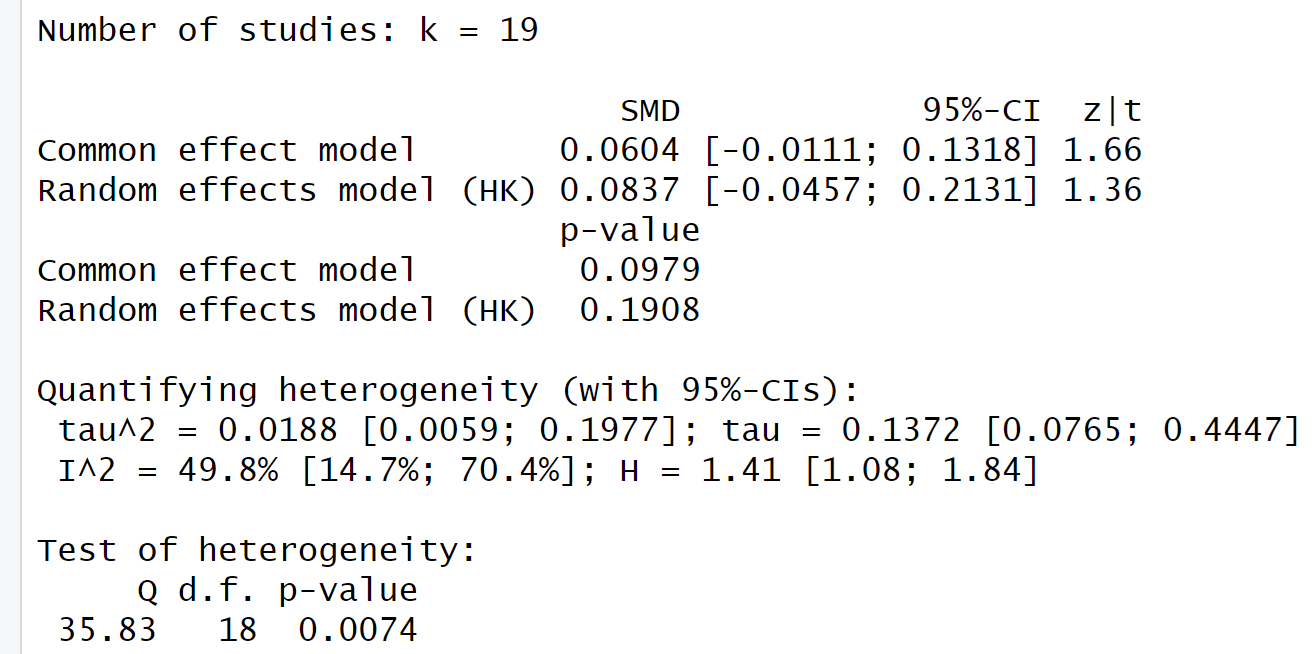
(e) Report the estimated “pooled effect size” treating the studies as random effects. Interpret the associated confidence interval in context. Would this meta-analysis suggest that the true treatment effect differs from zero?
(f) In this context, ![]() represents
the study-to-study variability in the true effect sizes. In other words, this
provides a measure of how homogeneous or heterogeneous the studies are. Does
the study-to-study variability in effect sizes appear to be statistically
significant? Justify your answer.
represents
the study-to-study variability in the true effect sizes. In other words, this
provides a measure of how homogeneous or heterogeneous the studies are. Does
the study-to-study variability in effect sizes appear to be statistically
significant? Justify your answer.
Relatedly, Cochran’s Q statistic is a weighted sum of squares comparing the individual study effects to the estimated common effect:
![]()
where ![]() is
the inverse of the study’s variance and
is
the inverse of the study’s variance and ![]() is
from the fixed effects model.
is
from the fixed effects model.
(g) Show a calculation of Cochran’s Q “by hand.” (show intermediate calculations in a spreadsheet?)
(h) If Q is large, this is evidence of “excess variation.” It is assumed that Q follows a chi-square distribution with df = k – 1 where k is the number of studies. What do you conclude from the R output?
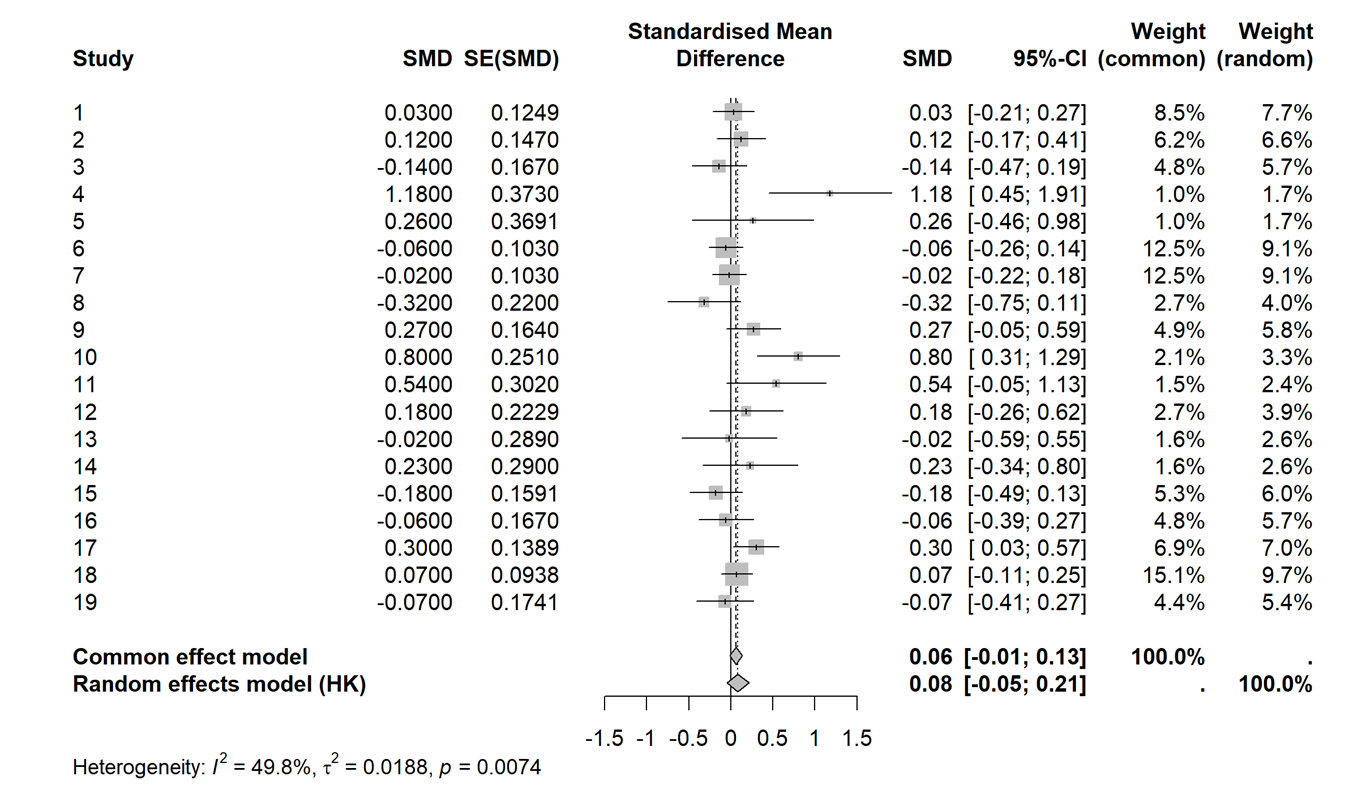
(i) A common visualization in a meta-analysis is a forest plot:
meta::forest(model1) #output below
Provide a brief summary of how the “fixed effects” results and the “random effects” results differ.
So maybe we shouldn’t pool these studies together, maybe small/negative effects are masking large positive effects? We can use a lot of our usual tools to check for outliers and influential studies. Maybe we can explain some of the variability across studies?
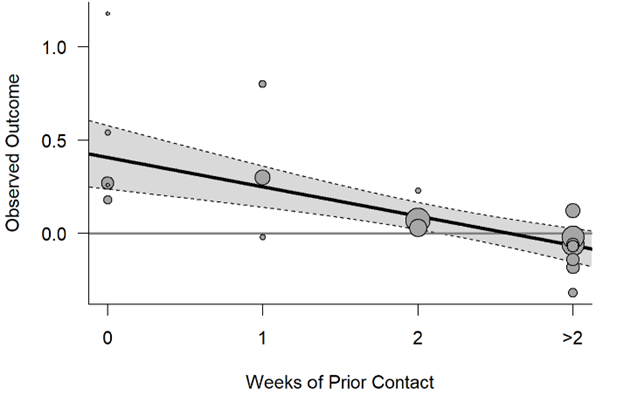
The “expectancy treatment” involved deception – in some cases researchers presented teachers with a list of pupils who allegedly displayed potential for tremendous intellectual or a list of students where they had inflated the IQ scores. (In reality, the student names on these lists were determined randomly.) One question is whether the teachers really believed these claims (and the treatment was truly applied). This could be related to how well the teachers knew their students when they were given the information. This is encapsulated in the “weeks of prior contact” variable.
(g) “Update” the meta-analysis to separate the studies based on the “number of prior contact weeks”
Recall weeks.b equals 1 if the number of weeks is larger than 1, 0 otherwise.
update(model1, subgroup= weeks.b, tau.common=FALSE)
1. In the Results for subgroups section, do the estimated effect sizes appear to differ substantially across the subgroups?
2. What do you learn from the test of subgroup differences for the fixed effects (common effect) model? (Hint: What are the df and why?)
3. What do you learn from the test of subgroup differences for the random effects model
(h) Summarize what you learn from the following graph (is it consistent with the discussion above?):