Stat 414 – Review 1 Problems
The following are
previous exam problems and application problems. The exam this quarter will also involve some more
“conceptual” problems as you have been seeing on the quizzes. I also expect
interpretation of output I provide. You won’t be using R live on the exam but I
could ask you questions about R commands.
You should assume all of the questions below have “Explain” after
them.
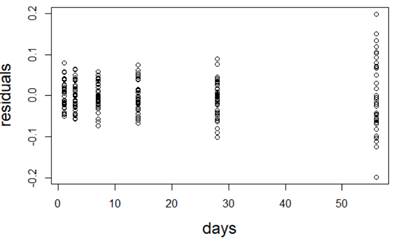
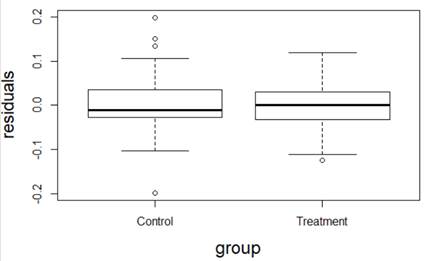
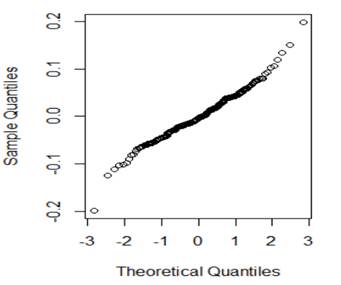
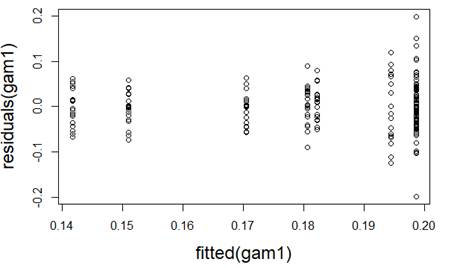
(a) I have fit a rather complicated single-level nonlinear model to these data (using days and group as explanatory variables). Assess the validity of my model. Be very clear how you are evaluating each assumption:
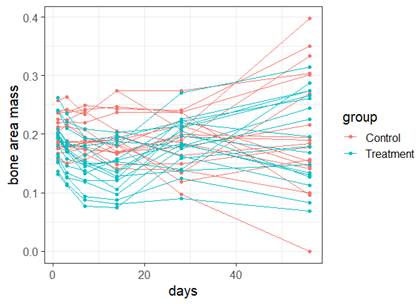
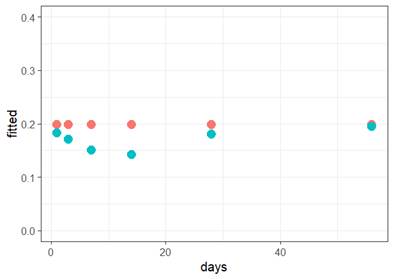
(b) Which of the following would you consider doing next to improve the validity of the model? Briefly justify your choice(s).
· Transformation to improve linearity
· Quadratic model to improve linearity
· Transformation of response to improve normality
· Transformation of explanatory to improve normality
· Include days in a weighted regression
·
Include group
in a weighted regression
·
Multilevel model using mouse as a grouping
variable (Level 2 units)
2) Here is another model for the FEV data
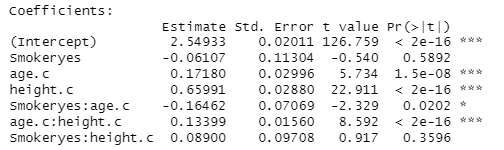
(a) Interpret the interaction between age and height in this context.
(b) How do you decide whether the interaction between age and height is statistically significant?
(c) How do you decide whether the association between age and height is statistically significant?
(d) Smoker doesn't appear to be very significant in the above model. Can I just remove it from the model?
(e) State the null and alternative hypotheses for removing Smoker from the model. Is the p-value for this test in the above output?
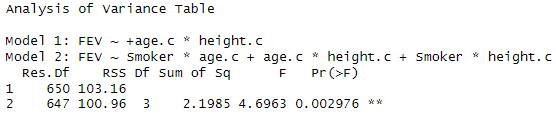
(f) What do you learn from the output below?
3) Recall our Squid data
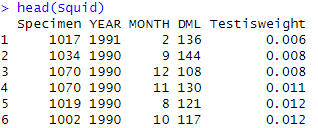
Squid$fMONTH = factor(Squid$MONTH)
plot(Testisweight ~ fMONTH,
data=Squid)
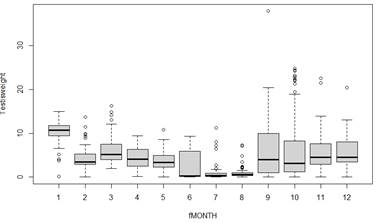
(a) Why did
we create fMONTH?
(b) Is there
seasonality in the data? Does the variability in the response appear to vary by
month? Identify 3 months where you think our predictions of Testisweight
will be most accurate. Least?
The graph
below shows the predicted values for each month (along with standard errors).
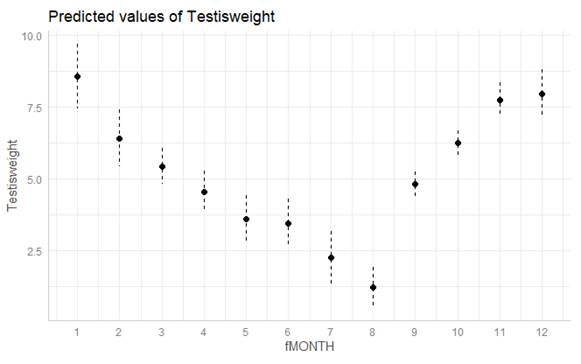
(c) If this
model was fit with indicator coding and fMONTH = 1 as
the reference group, is the coefficient of fMONTH2 positive or negative?
(d) If this
model was fit with effect coding, is the coefficient of fMONTH2 positive or
negative?
(e) Continuing (d): If
fMONTH1 is the missing category, will its coefficient be positive or negative?
These are
the fitted lines for the model that includes the interaction between fMONTH and DML
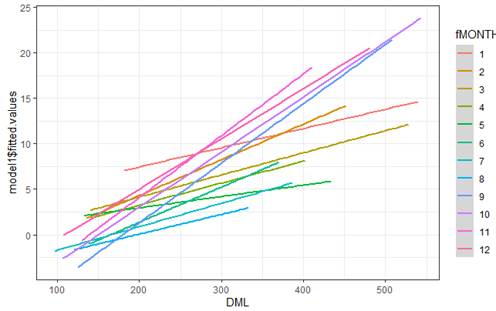
(f) How many
terms does including this interaction add to the model?
(g) Will the
coefficient of fMONTH10*DML be positive or negative?
But for
addressing the unequal variance: We don't want to assume a "linear
relationship" between the variability in the residuals and month number,
so we will estimate the variance for each month. We can do that by finding the
sample variance for each month.
(h) Which
months do we want to 'downweight' in estimating the
model?
(i)
Conjecture what changes you would expect to see in the previous two graphs in
this weighted regression model.
(j) How do
you expect the residual standard error to change?
·
price = price for one night (in dollars)
·
overall_satisfaction = rating on a 0-5 scale
·
room_type = Entire home/apt, Private room, or
Shared room
·
neighborhood = neighborhood where unit is
located (1 of 43)
(a) Identify the Level 1 units and the Level 2
units
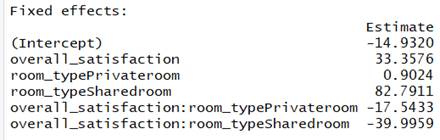
Consider the following output (Indicator parameterization was used for room size)
Fixed effects: Estimate Std. Error t value(Intercept) 25.353 26.454 0.958overall_satisfaction 24.919 5.508 4.524
room_typePrivateroom -82.739 3.831 -21.598
room_typeSharedroom -105.875 10.960 -9.660
> anova(model1)
Analysis of Variance Table Df Sum Sq Mean Sq F valueoverall_satisfaction 1 41558 41558 8.0542
room_type 2 2593431
1296715 251.3102
(b) Is the type of
room statistically significant? State
the null and alternative hypothesis in terms of regression parameters, and
clearly justify your answer.
5) Consider the following two models for
predicting language scores for 9 different schools. IQ_verb is the
student’s performance on a test of verbal IQ.
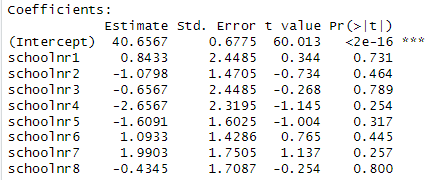
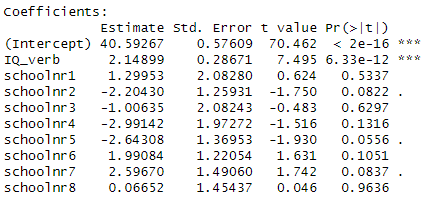
Which model demonstrates more school-to-school variability in language scores?