Stat 321 – Review II
Exam 2: Wednesday May 15
Optional Zoom Review Session: Tuesday May 14 6-8pm (will try to record)
You will be allowed to bring two sheets of notes into the exam but otherwise the exam will be closed books, closed notes. One of these pages can be the formulas pages at the end of this handout. You will put your names on these pages and turn them in with your exam. Bring your calculator. The exam will cover topics from Chapter 2 and Chapter 4. You should study from the text (sections 2.4, 4.1-4.8, 4.10), Lab 4-6, lecture notes (Days 14-23), Homeworks (HW 4-5), and Quizzes (3 and 4). In studying, I recommend reworking old homework and quiz problems without looking at the solutions, then checking your answers, then repeat. The questions will not be heavily computational, but you are expected to know how to carry out some of the calculations by hand and how to interpret Minitab output. You are also expected to explain your reasoning, show your steps, and interpret your results.
In general be able
to:
· Do everything from Review 1 (e.g., probability rules and how to use formulas)
· In particular: addition rule, multiplication rule, complement rule, conditional probability, law of total probability, Bayes’ rule
· Frequentist interpretation of probability
From Section 2.4 you should also be able to:
· Define a random variable (rv)
· Recognize a discrete vs. a continuous random variable
·
Determine the probability distribution
(pmf) for a discrete random variable
list the
outcomes and the probabilities of each outcome
may not be
a bad idea to start listing out elements of the sample space until see a
pattern
· Know the difference between p(x), f(x) and F(x)
pmf = probability mass function (discrete random variables)
pdf = probability density function (continuous random variables)
cdf = cumulative probability function (discrete or continuous random variables)
· Verify whether a pdf or pmf is a legitimate probability function
· Display the probability mass function (pmf) as a “line graph” (including labeling the axes)
· Sketch a pdf for all values of x (including labeling the axes)
·
Integrate a pdf to determine probabilities
(above, below, between)
·
Determine percentiles (given a probability, find
x working backwards)
· Sketch cdf for all values of x for discrete or continuous random variables
· Find (calculate/graph) the cumulative distribution function from pmf or pdf
· Determine the p(x) or f(x) from F(x), along with defining their domain
· Note, for continuous random variables, we differentiate
· Use the p(x) or f(x) or F(x) to find probabilities of interest
· Calculate and interpret the expected value of discrete or continuous random variable
· Calculate the expected value of a function of a random variable, e.g., h(X)
Usually not h(E(X))
Unless linear function: E(aX+b) = aE(X)+b
· Calculate/interpret the variance of a discrete or continuous random variable
For discrete and continuous rvs short-cut formula: E(X2)-[E(X)]2
Var(aX+b) = a2Var(X)
· Work backwards to find percentile from a specified probability (e.g., the value of the median)
From Chapter 4 you should also be able to:
· Identify the appropriate distribution for discrete random variables
- Binomial = number of successes in n independent trials
- Hypergeometric = number of success in n dependent trials
Binomial approximation (when population > 20n)
- Negative Binomial =number of failures before rth success
Geometric = number of failures before first success
- Poisson = number of rare events in fixed interval
Poisson approximation of Binomial (large n, small p)
· Calculate and interpret requested probability (by hand and/or computer output)
- Including how to decide whether you have evidence against some claim about the parameter (e.g., probability match name to face is 0.75)
· Calculate probabilities for specific continuous random variables
(e.g., when to use a table, when to use cdf, when to integrate)
- Uniform distribution on [A,B] (get probabilities from P(a<X<b) = (b-a)/(B-A) )
- Normal Distribution, Standard Normal Distribution and their properties
Standard unit: [Z=(X-m)/s]
Be able to interpret Z value in terms of number of standard deviations away (above or below) from the mean
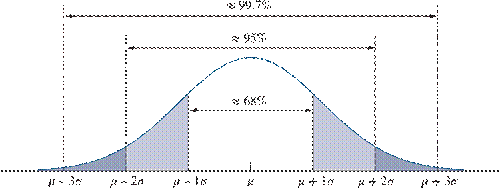
Be able to apply the Empirical Rule (68/95/99.7)
Be able to work “backwards” (e.g., find x, find m)
- Gamma Distribution
Use formulas for mean and SD
Exponential (get probabilities from CDF)
- Weibull (get probabilities from CDF)
- Lognormal
- Beta (get probabilities by integrating)
General Comments:
· Be able to distinguish which discrete random variable is appropriate based on the question asked (e.g, fixed number of trials vs. fixed number of successes). You will be told or asked to investigate which continuous distribution is appropriate (to model data).
· You should be prepared to give a bit more explanation than in homeworks. This includes details in notation, summations S, graphs, calculations, but also interpretations. Practice writing out the definition of the random variable, e.g., “Let X represent…”
· You may need to be able to define symbols in the formulas, e.g., M, N, n, p, r, etc.
SOME NOTES FROM LAB 4
·
Interpret
probability as long-run average
·
In
comparing the two bets, consider expected value but also variability/risk
·
Law of
Large Numbers: The sample mean outcome calculated from repeated independent
observations of a random variable will approach the expected value
(casinos/insurance companies survive on volume)
·
Know the
difference between E(Y2) vs. V(Y) vs. SD(Y) and be able to assign
measurement units to each
·
Be able
to distinguish between data and a probability model
·
Be able
to justify (check conditions of) a binomial random variable in context
SOME NOTES FROM LAB 5
· Understand the process of statistical inference: Make a claim about a parameter value, assess the plausibility of that claim based on data
o Frequentist: Reject hypothesis if p-value (probability of the observed result or more extreme when the hypothesis is true) is small. The result is then considered “statistically significant” = unlikely to happen by random chance alone when the null hypothesis is true.
o Bayesian: Calculate the probability (distribution) for the parameter based on the observed result (update hypothesis based on evidence)
· Also think about data collection issues, e.g., is the sample likely to be a good representation of the larger population
SOME NOTES FROM LAB 6
·
Be able
to distinguish between data and a probability model
·
Understand
properties of the distributions, e.g., gamma vs. exponential which can’t ever
increase and think about limitations of the models for a particular context
(e.g., no magnitudes < 1)
·
The
probability plot is probably the best single criteria to use to compare how
well these models fit the data
SOME NOTES FROM QUIZ 3
·
Understand
properties of cdf vs. pmf (and pdf)
·
Keep in
mind some of the big lessons from data distributions
SOME NOTES FROM QUIZ 4
·
Be very careful and clear in how define random
variables
·
Read instructions carefully (which information
is required, what can be skipped)
·
If can use one of the common probability
distributions, do so – don’t unnecessarily reinvent the wheel
·
Be able “set-up” calculations/show the details
(even if do complete the calculation)
·
Be able to explain implications of probability
calculation
SOME PROBLEM SOLVING
STRATEGIES
If you are asked to
determine a probability
1. Are you finding a conditional or an unconditional probability?
3. If it involves a random variable which follows one of the common probability distributions (e.g., binomial, gamma) then use the formulas page and/or tables.
Look for the phrase “approximate probability” in case one of the approximations (e.g., poisson to binomial) might apply.
You may have to recognize whether it belongs to a known discrete probability family yourself.
4. If it involves a random variable but you are given the pmf or pdf, determine the probability directly (summing or integrating).
If you are asked to
determine the expected value of an expression
1. If the expression is a linear function of random variable, first simplify using the rules for expected value
e.g., E(2X+3) = 2E(X)+3
3. Once you get to E(Y), is Y a random variable from a common probability distribution family? If so, use the formulas page to determine the expected value
e.g., if Y is a binomial random variable, E(Y)=np
4. If Y is not from a common probability distribution family, determine E(Y) or E(h(Y)) directly given the pmf (summing) or pdf (integrating)
discrete: E(Y) = SyP(Y=y) E(h(Y)) = Sh(y)P(Y=y)
continuous: E(Y) = òyf(y)dy E(h(Y)) = òh(y)f(y)dy
If you are asked to
determine the variance of an expression
1. If the expression is a linear function of random variable, first simplify using the rules for variance
e.g., V(2X+3) = 4V(X)
3. Once you get to V(Y), is Y a random variable from a common probability distribution family? If so, use the formulas page to determine the variance
e.g., if Y is a binomial random variable, V(Y)=np(1-p)
4. If Y is not from a common probability distribution family, determine V(Y) directly given the pmf or pdf using V(Y)=E(Y2)-[E(Y)]2
discrete: E(Y2) = Sy2P(Y=y) continuous: E(Y2) = òy2f(y)dy
·
Be able
to make interpretations and explanations of your calculations
·
Remember
to follow the “of,” probability “of what”?!
Stat 321 - Formulas