Stat 301 – HW 3
Due midnight, Friday, Jan. 26
Please
remember to put your name(s) inside the file and if submitting jointly to join
a HW 3 group first. Please use Word or PDF format only. Remember to integrate your output with your
discussion. Points will be deducted if
you are missing output.
1) Finish your water journal and submit
your results by Feb. 2. Include your
answers to (a)-(e) now.
After
the 7 days, open the water use survey
(you will need to make a copy first) and complete rows 2-15 (and indicate CA
for the state you live in). Be sure to make any conversions you need before
entering your values in column D (e.g., average per day, number per year).. Everyone will
leave rows 16-20 blank. When you have completed your journal, use the “Water
Survey” link in
Canvas to::
(a)
Upload a copy of your journal
(b)
Report your Total (Individual Daily Use) from cell F21.
Then
also answer:
(c)
Report any suspected data quality errors.
(d)
Suppose we find the average water usage (find the mean of all your answers to
b), will this be a parameter or a statistic?
Then define in words a corresponding statistic/parameter.
(e)
Suggest a research question you could explore using one of these
variables.
2) Hill and Barton (Nature, 2005) conducted a study to
investigate whether Olympic athletes in certain uniform colors have an
advantage over their competitors. They noted that competitors in the combat
sports of boxing, tae kwon do, Greco-Roman wrestling, and freestyle wrestling
are randomly assigned to wear red or blue uniforms. For each match in the 2004
Olympics, they recorded the uniform color of the winner. They found that in 457
Olympic combat sport matches, the competitor wearing red won 248 times
(successes), while the person wearing blue won 209 times (failures).
(a) Identify the
observational units and variable of interest in this study.
(b) Define the
parameter in words (in context).
(c) State appropriate
null and alternative hypotheses in symbols and/or words.
(d) Report the sample
proportion, ![]() .
.
(e) Is the normal
approximation to the binomial distribution likely to be valid for this study?
Explain how you are deciding.
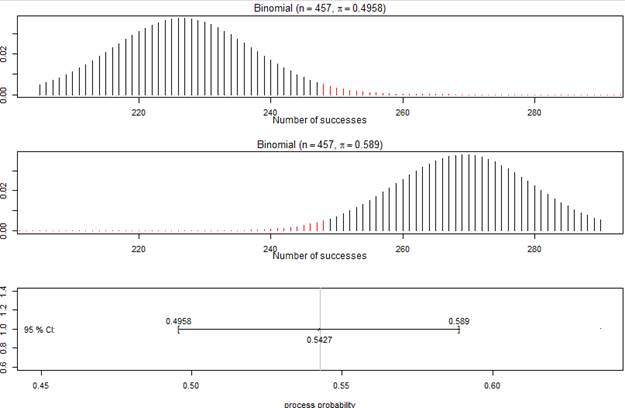
(f) Find both the exact
binomial p-value and the p-value from the one-sample z-test using R or
the One Proportion Inference applet. (Include a copy of the distributions
overlaid.) Are they similar? Does the
similarity/lack of similarity of these values surprise you? Explain.
(g) Report and
interpret, in context, the standardized statistic from (f).
(h) The continuity
correction is discussed in Investigation 1.8. Use R or the applet to perform a continuity
correction for the calculations in (f).
Does this continuity correction improve the normal approximation of the
exact binomial calculation for this situation? (Make sure you are including
sufficient output.)
(i) Below is the exact
binomial confidence interval from R
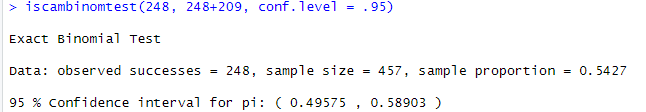
Interpret the interval
in context.
(j) Are the confidence
interval and binomial p-value consistent with each other? Explain how you are
deciding.
(k) Use R or the
Theory-Based Inference applet to
find a 95% z-confidence interval.
Are the z-interval and exact binomial confidence intervals
similar? Is this what you would expect for these data? Explain.
(l) The adjusted-Wald
confidence interval procedure is discussed in Investigation 1.9. The procedure
is to add two successes and two failures to the sample before computing the z-confidence
interval. Use technology to find the 95%
adjusted-Wald confidence interval. Make
sure it’s clear how you are doing so.
(m) Compare the widths
of the three confidence intervals you have found. (Use 4 decimal places.) Which
is the shortest?
(n) Report the
half-width (aka margin of error) for the one-proportion z-confidence
interval in (k). Compare this value to ![]() . Based on the formula
for the margin of error in the 95% one-proportion z-confidence interval,
why does this approximation make sense?
. Based on the formula
for the margin of error in the 95% one-proportion z-confidence interval,
why does this approximation make sense?
(o) So a short-cut
approximation to the one-proportion z-confidence interval is ![]() . If anything, this interval will be wider than
it needs to be (is “conservative”).
Why? (Hint: How
does the standard error formula change with
. If anything, this interval will be wider than
it needs to be (is “conservative”).
Why? (Hint: How
does the standard error formula change with ![]() ?)
?)
Keep in mind
·
In
this class, we will use the term standard error to refer to an estimate
of the standard deviation of the statistic (computed entire from information
available in the sample data). Interpret a standard error just like you would
the standard deviation of the statistic (e.g., a typical deviation of the
statistic from the parameter across different samples).
·
If
I don’t give you a confidence level, assume 95%.