Exam 1 Review Problems
1) Suppose that the observational units in a study are the
patients arriving at an emergency room in a given day. For each of the
following, indicate whether it can legitimately be considered a variable or
not. If it is a variable, classify it as categorical (and if it is binary) or
quantitative. If it is not a variable, explain why not.
a. Blood type
b. Waiting time
c. Mode of arrival (ambulance, personal car, on foot, other)
d. Whether or not men have to wait longer than women
e. Number of patients who arrive before noon
f. Whether or not the patient is insured
g. Number of stitches required
h. Whether or not stitches are required
i. Which patients require stitches
j. Number of patients who are insured
k. Assigned room
number
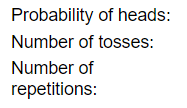
2) When a tennis racquet is spun, is it equally likely to
land with its label facing up or down? (This technique is often used to decide
who should serve first.) Or does the spinning process favor one outcome more
than the other? A statistics professor once investigated this question by
spinning his tennis racquet many times. For each spin he recorded whether the
racquet landed with the label up or down.
(a) Describe
(in words) the relevant parameter whose value is being investigated with this
study.
(b) Write the
appropriate null and alternative hypotheses (in symbols).
He spun his
racquet 100 times, finding that it landed with the label up in 46 of those
spins.
(c) Would you
consider these 100 spins to be a sample from a random process or a random
sample from a population? Explain briefly.
![]()
(e)
Based on the output below, what is the simulation-based p-value?
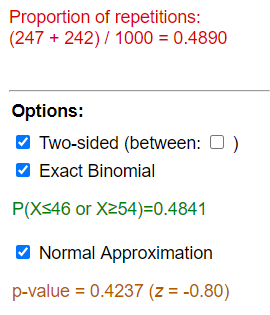
(f)
What are the parameters of the binomial distribution: n = and ![]() = and we found P(X ? )?
= and we found P(X ? )?
(g) Check
whether the normal approximation (Central Limit Theorem) is valid here.
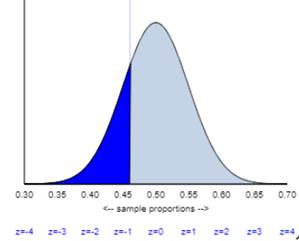
(h) Describe what
the CLT says about the (approximate) sampling distribution of the sample
proportion ![]() , assuming that the null hypothesis is true. Be sure
to describe each of shape, mean, and standard deviation, and to include a rough
sketch (but well labeled) of the distribution.
, assuming that the null hypothesis is true. Be sure
to describe each of shape, mean, and standard deviation, and to include a rough
sketch (but well labeled) of the distribution.
(j) Calculate
(by hand) and interpret the test statistic by finding the z-score for the
observed sample proportion ![]() .
.
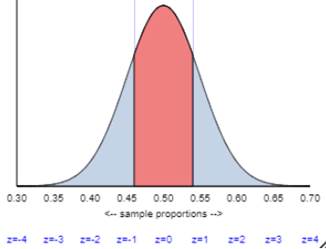
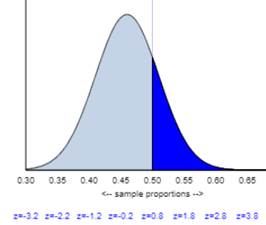
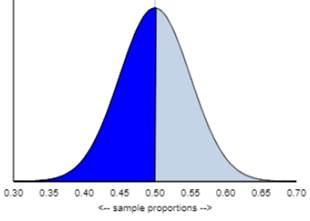
(k) Which of the following graphs would be correct for finding the
one-proportion z-test p-value?
(l) What test
decision would you make at the .05 significance level?
(m) Do the
validity conditions for the (Wald) normal-based confidence interval (one sample
z-interval) hold here?
(n) Produce and
interpret a 95% confidence interval for the parameter, using the Wald procedure
(one sample z-interval) if the conditions are met but using the Plus Four
procedure if they are not met.
(p) Is the
confidence interval consistent with the test decision? Explain.
(q) Summarize
your conclusion about the original question that motivated this study.
(r) Summarize
how your calculations and conclusions would change if you instead examined the
54 spins that landed label down.
(s) Use the
normal approximation to determine how large the sample size n needs to be in order for the 95%
confidence interval to have margin-of-error < .08.
3) Findings at James Madison University indicate that 21% of
students eat breakfast 6 or 7 times a week.
A similar question was asked of a sample of 159 Cal Poly students. Of
the 97 who responded, 35 reported eating breakfast 6 or 7 times a week. Is this convincing evidence that Cal Poly
students have healthier breakfast habits (i.e., more likely to eat breakfast)
than James Madison students? More
specifically, are you convinced that more than 21% of all Cal Poly students eat
breakfast 6 or 7 times weekly?
(a) Define the population of interest and the sample being
considered.
(b) Define the parameter and the statistic for
this study.
(c) Is the population size large compared to
the sample size to allow us to use the binomial model to this sampling process?
(d) Estimate a
p-value for addressing this question. Clearly explain how you are doing so and
report this p-value.
(e) What
conclusion would you draw from this p-value?
(f) Provide an
interpretation of this p-value as if to someone not taking a statistics class.
(g) If you took
another random sample of 159 Cal Poly students, which of your answers to part b
would change?
(h) What are
your thoughts about the fact that only 97 out of the original random sample of
159 responded?
(i) Suppose you
plan to conduct a new study with a simple random sample of 1,590 Cal Poly
students. Explain how you could obtain this sample.
(j) Would this
new sample size address the issue you identified in part h?
(k) How would
you expect this p-value in part d to change if of the 1,590 Cal Poly students
you sample 36% reported eating breakfast 6 or 7 times a week (larger, smaller,
or about the same)? Explain (without finding a new p-value!).