Solutions
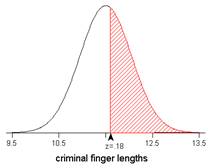
1. This student should start with a sketch of the normal curve, shading the probability of interest.
Then the student should label the calculation as being that of the z-score. Both of these steps should have reminded the student that the z-score has been calculated, but the next step is to use Table II to convert this z-score into a probability. This probability turns out to be .57, which is much more consistent with the sketch. In particular, you know the probability has to be larger than .5 because the observation of interest was larger than the mean. This student also failed in all four answers to state the solution in context—18% of what? Make sure it is clear from your final statement what the observational units and variable are, for example, “57% of criminal finger lengths are less than 11.6 cm.”
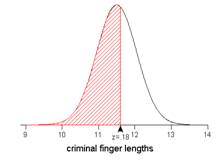
2. This time the student did look up the z-score in Table II to find a probability. But the probability reported is the probability that a finger length is less than 11.6 cm. She needs to subtract from 1 in order to find the probability that a finger length is longer than 11.6 cm: 1 - .5714 = .4286, so about 43% of finger lengths are longer than 11.6 cm.
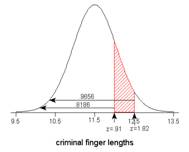
3. The z-scores are calculated correctly, but it’s their probabilities that must be subtracted, not the z-scores themselves. Table II reveals these probabilities to be .9656 and .8186; .9596-.8186 = .1470, so about 15% of the finger lengths are between 12 and 12.5 cm.
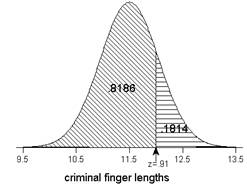
4. The students has remembered that when calculating the probability that the outcome is greater than a certain value, something is subtracted from 1. However, she must convert to a probability in Table II first (.8186) and then subtract the probability from 1 (1 - .8186 = .1814), not the z-score.